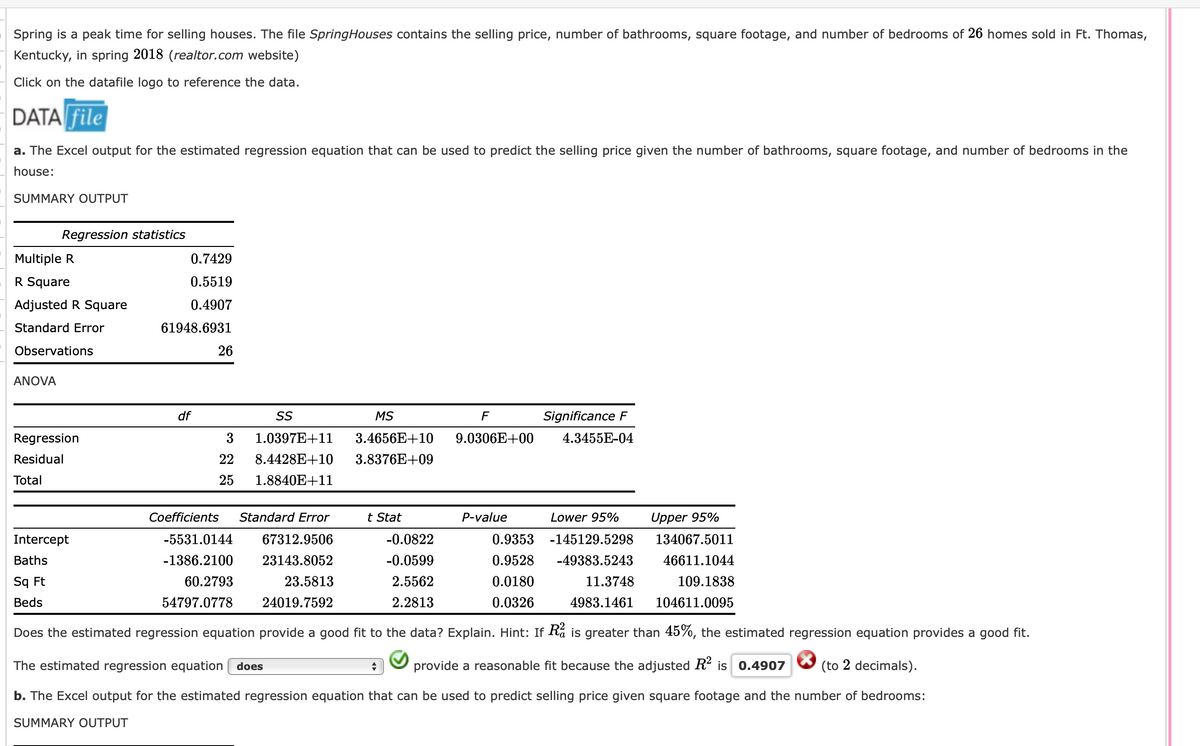
Spring is a peak time for selling houses. The file Spring Houses contains the selling price, number of bathrooms, square footage, and number of bedrooms of 26 homes sold in Ft. Thomas, Kentucky, in spring 2018 (realtor.com website) Click on the datafile logo to reference the data. DATA file a. The Excel output for the estimated regression equation that can be used to predict the selling price given the number of bathrooms, square footage, and number of bedrooms in the house: SUMMARY OUTPUT Regression statistics Multiple R R Square Adjusted R Square Standard Error Observations ANOVA Regression Residual Total 0.7429 0.5519 0.4907 61948.6931 Intercept Baths df 26 SS MS 3 1.0397E+11 3.4656E+10 22 8.4428E+10 3.8376E+09 25 1.8840E+11 Coefficients Standard Error -5531.0144 67312.9506 -1386.2100 23143.8052 23.5813 60.2793 54797.0778 24019.7592 t Stat F 9.0306E+00 Lower 95% Upper 95% -0.0822 0.9353 -145129.5298 134067.5011 -0.0599 0.9528 -49383.5243 46611.1044 Sq Ft 2.5562 0.0180 11.3748 109.1838 Beds 2.2813 0.0326 4983.1461 104611.0095 Does the estimated regression equation provide a good fit to the data? Explain. Hint: If R is greater than 45%, the estimated regression equation provides a good fit. The estimated regression equation does (to 2 decimals). provide a reasonable fit because the adjusted R² is 0.4907 b. The Excel output for the estimated regression equation that can be used to predict selling price given square footage and the number of bedrooms: SUMMARY OUTPUT P-value Significance F 4.3455E-04
Spring is a peak time for selling houses. The file Spring Houses contains the selling price, number of bathrooms, square footage, and number of bedrooms of 26 homes sold in Ft. Thomas, Kentucky, in spring 2018 (realtor.com website) Click on the datafile logo to reference the data. DATA file a. The Excel output for the estimated regression equation that can be used to predict the selling price given the number of bathrooms, square footage, and number of bedrooms in the house: SUMMARY OUTPUT Regression statistics Multiple R R Square Adjusted R Square Standard Error Observations ANOVA Regression Residual Total 0.7429 0.5519 0.4907 61948.6931 Intercept Baths df 26 SS MS 3 1.0397E+11 3.4656E+10 22 8.4428E+10 3.8376E+09 25 1.8840E+11 Coefficients Standard Error -5531.0144 67312.9506 -1386.2100 23143.8052 23.5813 60.2793 54797.0778 24019.7592 t Stat F 9.0306E+00 Lower 95% Upper 95% -0.0822 0.9353 -145129.5298 134067.5011 -0.0599 0.9528 -49383.5243 46611.1044 Sq Ft 2.5562 0.0180 11.3748 109.1838 Beds 2.2813 0.0326 4983.1461 104611.0095 Does the estimated regression equation provide a good fit to the data? Explain. Hint: If R is greater than 45%, the estimated regression equation provides a good fit. The estimated regression equation does (to 2 decimals). provide a reasonable fit because the adjusted R² is 0.4907 b. The Excel output for the estimated regression equation that can be used to predict selling price given square footage and the number of bedrooms: SUMMARY OUTPUT P-value Significance F 4.3455E-04

Glencoe Algebra 1, Student Edition, 9780079039897, 0079039898, 2018
18th Edition
ISBN:9780079039897
Author:Carter
Publisher:Carter
Chapter4: Equations Of Linear Functions
Section4.6: Regression And Median-fit Lines
Problem 1CYU

Related questions
Question
fix whats wrong please
Transcribed Image Text:Spring is a peak time for selling houses. The file Spring Houses contains the selling price, number of bathrooms, square footage, and number of bedrooms of 26 homes sold in Ft. Thomas,
Kentucky, in spring 2018 (realtor.com website)
Click on the datafile logo to reference the data.
DATA file
a. The Excel output for the estimated regression equation that can be used to predict the selling price given the number of bathrooms, square footage, and number of bedrooms in the
house:
SUMMARY OUTPUT
Regression statistics
Multiple R
R Square
Adjusted R Square
Standard Error
Observations
ANOVA
Regression
Residual
Total
0.7429
0.5519
0.4907
61948.6931
df
26
SS
1.0397E+11
22 8.4428E+10
25 1.8840E+11
Coefficients Standard Error
-5531.0144
-1386.2100
60.2793
54797.0778
MS
3.4656E 10 9.
3.8376E+09
t Stat
F
C+00
P-value
Lower 95%
Upper 95%
Intercept
67312.9506
-0.0822
0.9353 -145129.5298
134067.5011
Baths
23143.8052
-0.0599
0.9528 -49383.5243
46611.1044
Sq Ft
23.5813
2.5562
0.0180
11.3748
109.1838
Beds
24019.7592
2.2813
0.0326
4983.1461
104611.0095
Does the estimated regression equation provide a good fit to the data? Explain. Hint: If Rª is greater than 45%, the estimated regression equation provides a good fit.
The estimated regression equation does
provide a reasonable fit because the adjusted R² is 0.4907 (to 2 decimals).
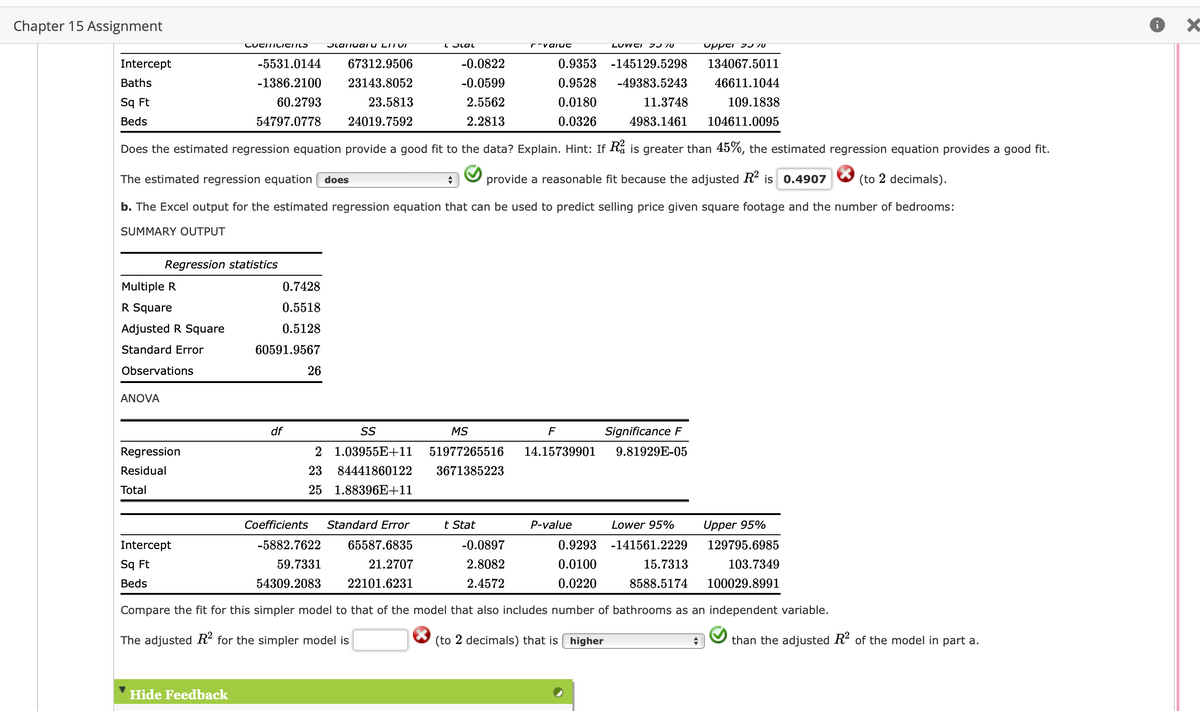
b. The Excel output for the estimated regression equation that can be used to predict selling price given square footage and the number of bedrooms:
SUMMARY OUTPUT
Significance F
4.3455E-04
Transcribed Image Text:Chapter 15 Assignment
Multiple R
R Square
Adjusted R Square
Standard Error
Observations
ANOVA
Regression statistics
Regression
Residual
Total
CUCITICICTICS
upper 35 70
Intercept
0.9353 -145129.5298
134067.5011
67312.9506
23143.8052
Baths
46611.1044
0.9528 -49383.5243
0.0180
Sq Ft
11.3748
109.1838
23.5813
24019.7592
Beds
0.0326
4983.1461
104611.0095
Does the estimated regression equation provide a good fit to the data? Explain. Hint: If Ra is greater than 45%, the estimated regression equation provides a good fit.
The estimated regression equation does
provide a reasonable fit because the adjusted R² is 0.4907 (to 2 decimals).
b. The Excel output for the estimated regression equation that can be used to predict selling price given square footage and the number of bedrooms:
SUMMARY OUTPUT
Intercept
Sq Ft
Beds
-5531.0144
-1386.2100
60.2793
54797.0778
Hide Feedback
0.7428
0.5518
0.5128
60591.9567
df
Stanical U LITUI
26
i Stal
Coefficients Standard Error
-5882.7622
59.7331
54309.2083
-0.0822
-0.0599
2.5562
2.2813
SS
MS
2 1.03955E+11 51977265516
23 84441860122 3671385223
25 1.88396E+11
r-valuc
t Stat
F
14.15739901
Lower 95%
Upper 95%
129795.6985
65587.6835
-0.0897
0.9293 -141561.2229
2.8082
0.0100
103.7349
21.2707
22101.6231
2.4572
0.0220
100029.8991
Compare the fit for this simpler model to that of the model that also includes number of bathrooms as an independent variable.
The adjusted R² for the simpler model is
(to 2 decimals) that is higher
LUWCI 7570
P-value
Significance F
9.81929E-05
15.7313
8588.5174
+ than the adjusted R² of the model in part a.
×
Expert Solution
This question has been solved!
Explore an expertly crafted, step-by-step solution for a thorough understanding of key concepts.

This is a popular solution!

Trending now
This is a popular solution!

Step by step
Solved in 3 steps

Recommended textbooks for you
Glencoe Algebra 1, Student Edition, 9780079039897…
Algebra
ISBN:
9780079039897
Author:
Carter
Publisher:
McGraw Hill

Algebra and Trigonometry (MindTap Course List)
Algebra
ISBN:
9781305071742
Author:
James Stewart, Lothar Redlin, Saleem Watson
Publisher:
Cengage Learning

Functions and Change: A Modeling Approach to Coll…
Algebra
ISBN:
9781337111348
Author:
Bruce Crauder, Benny Evans, Alan Noell
Publisher:
Cengage Learning
Glencoe Algebra 1, Student Edition, 9780079039897…
Algebra
ISBN:
9780079039897
Author:
Carter
Publisher:
McGraw Hill
Algebra and Trigonometry (MindTap Course List)
Algebra
ISBN:
9781305071742
Author:
James Stewart, Lothar Redlin, Saleem Watson
Publisher:
Cengage Learning
Functions and Change: A Modeling Approach to Coll…
Algebra
ISBN:
9781337111348
Author:
Bruce Crauder, Benny Evans, Alan Noell
Publisher:
Cengage Learning


Trigonometry (MindTap Course List)
Trigonometry
ISBN:
9781305652224
Author:
Charles P. McKeague, Mark D. Turner
Publisher:
Cengage Learning

Big Ideas Math A Bridge To Success Algebra 1: Stu…
Algebra
ISBN:
9781680331141
Author:
HOUGHTON MIFFLIN HARCOURT
Publisher:
Houghton Mifflin Harcourt