(square symbols) to shade the area representing government revenue received from the tariff and the tan triangles (dash symbols) to shade the areas representing the net loss or deadweight loss (DWL) caused by the tariff. PRICE (Dollars per ton) 680 Domestic Demand Domestic Supply 640 600 560 520 480 440 400 360 320 World Price Plus Tariff CS PW ↓ I PS Government Revenue 280 0 5 10 15 20 25 30 35 40 45 50 DWL QUANTITY (Thousands of tons of soybeans) Complete the following table to summarize your results from the previous two graphs. Under Free Trade (Dollars) Under a Tariff (Dollars) Consumer Surplus Producer Surplus Government Revenue 0 (?) Based on your analysis, as a result of the tariff, Colombia's consumer surplus by $ , producer surplus by $ , and the government collects $ in revenue. Therefore, the net welfare effect is a of $
(square symbols) to shade the area representing government revenue received from the tariff and the tan triangles (dash symbols) to shade the areas representing the net loss or deadweight loss (DWL) caused by the tariff. PRICE (Dollars per ton) 680 Domestic Demand Domestic Supply 640 600 560 520 480 440 400 360 320 World Price Plus Tariff CS PW ↓ I PS Government Revenue 280 0 5 10 15 20 25 30 35 40 45 50 DWL QUANTITY (Thousands of tons of soybeans) Complete the following table to summarize your results from the previous two graphs. Under Free Trade (Dollars) Under a Tariff (Dollars) Consumer Surplus Producer Surplus Government Revenue 0 (?) Based on your analysis, as a result of the tariff, Colombia's consumer surplus by $ , producer surplus by $ , and the government collects $ in revenue. Therefore, the net welfare effect is a of $

Essentials of Economics (MindTap Course List)
8th Edition
ISBN:9781337091992
Author:N. Gregory Mankiw
Publisher:N. Gregory Mankiw
Chapter9: Application: International Trade
Section: Chapter Questions
Problem 2PA
Question
please answer in text form and in proper format answer with must explanation , calculation for each part and steps clearly
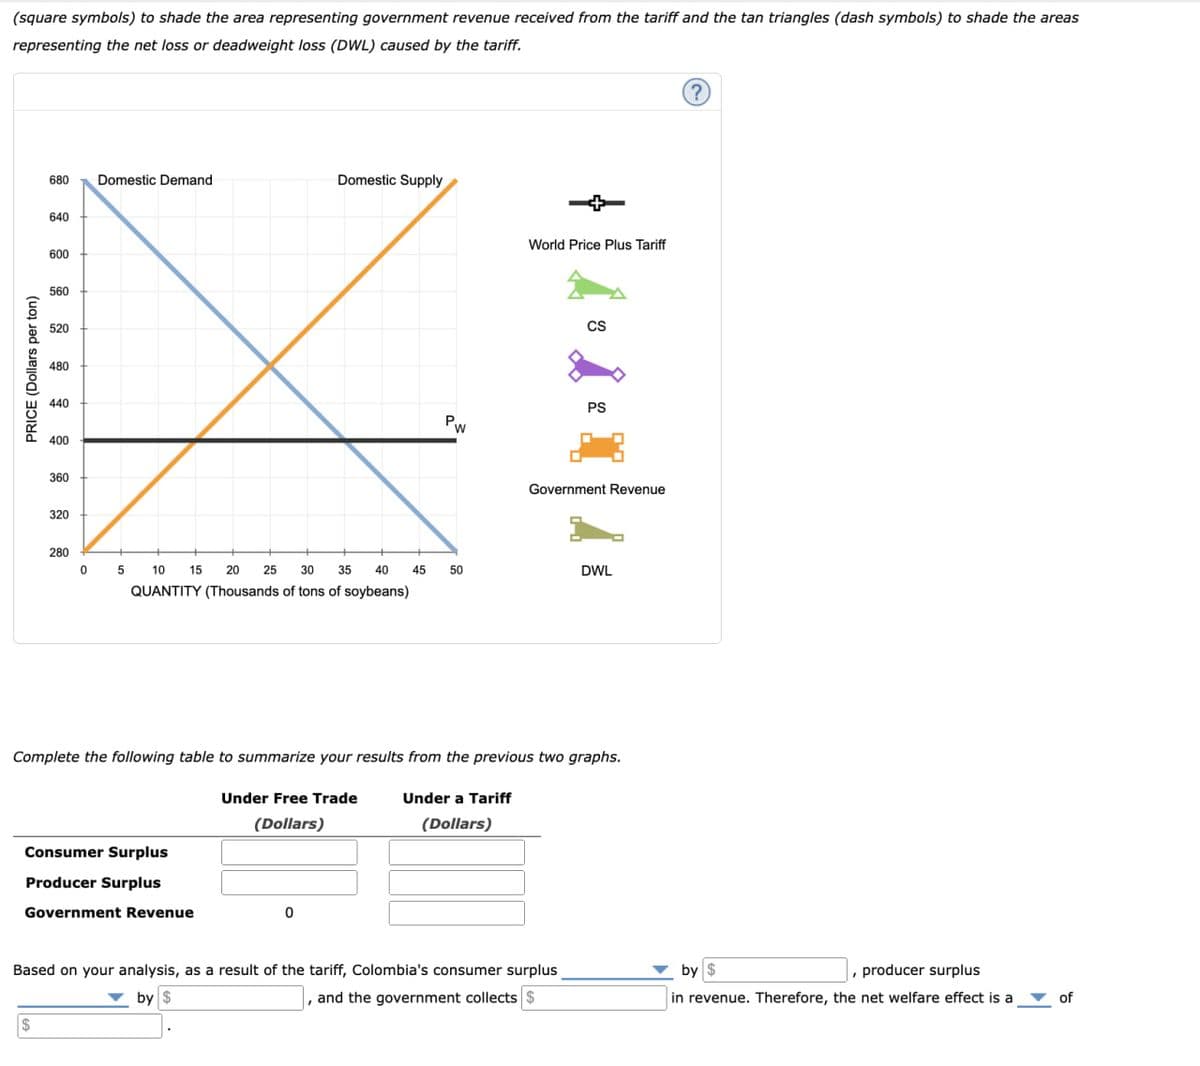
Transcribed Image Text:(square symbols) to shade the area representing government revenue received from the tariff and the tan triangles (dash symbols) to shade the areas
representing the net loss or deadweight loss (DWL) caused by the tariff.
PRICE (Dollars per ton)
680
Domestic Demand
Domestic Supply
640
600
560
520
480
440
400
360
320
World Price Plus Tariff
CS
PW
↓ I
PS
Government Revenue
280
0
5
10
15
20
25
30
35
40
45
50
DWL
QUANTITY (Thousands of tons of soybeans)
Complete the following table to summarize your results from the previous two graphs.
Under Free Trade
(Dollars)
Under a Tariff
(Dollars)
Consumer Surplus
Producer Surplus
Government Revenue
0
(?)
Based on your analysis, as a result of the tariff, Colombia's consumer surplus
by $
, producer surplus
by $
, and the government collects $
in revenue. Therefore, the net welfare effect is a
of
$
Expert Solution
This question has been solved!
Explore an expertly crafted, step-by-step solution for a thorough understanding of key concepts.

Step by step
Solved in 2 steps

Recommended textbooks for you
Essentials of Economics (MindTap Course List)
Economics
ISBN:
9781337091992
Author:
N. Gregory Mankiw
Publisher:
Cengage Learning
Essentials of Economics (MindTap Course List)
Economics
ISBN:
9781337091992
Author:
N. Gregory Mankiw
Publisher:
Cengage Learning