Standard coefficients from multiple regression analyses for incarceration rate predicting child health outcomes in the U.S. (No omitted variables) Infant Mortality Child Mortality Incarceration rate Unemployment rates Household income Poverty rates Education level - Some Education level - None Total population N R .0879613* .0391215 -.0207576 .0248947 -.27434 .8331692 -.5902877* 30 0.9953 0.9924 343.98 Adjusted R2 F *Significant at 95% confidence level .5806432* -.1739872 -4847568 -.4188822 1.091324 -.2807465 .6726121 30 0.7188 0.5469 4.18 Teen Mortality .2183777 .0729224 .5809326 .0041706 -1.831384 -1.760656 4.471526 30 0.6517 0.4389 3.06 Pre-term Birth -.0502726 -.0054684 .0230085 -.0387071 .6161558 -.8866275* .5641498* 30 0.9971 0.9954 565.79 Low Birth Weight -.1097773 -.5404714* .2795803 .1467784 -8.587054 5.010042 .1836783 30 0.6163 0.3818 2.63
Standard coefficients from multiple regression analyses for incarceration rate predicting child health outcomes in the U.S. (No omitted variables) Infant Mortality Child Mortality Incarceration rate Unemployment rates Household income Poverty rates Education level - Some Education level - None Total population N R .0879613* .0391215 -.0207576 .0248947 -.27434 .8331692 -.5902877* 30 0.9953 0.9924 343.98 Adjusted R2 F *Significant at 95% confidence level .5806432* -.1739872 -4847568 -.4188822 1.091324 -.2807465 .6726121 30 0.7188 0.5469 4.18 Teen Mortality .2183777 .0729224 .5809326 .0041706 -1.831384 -1.760656 4.471526 30 0.6517 0.4389 3.06 Pre-term Birth -.0502726 -.0054684 .0230085 -.0387071 .6161558 -.8866275* .5641498* 30 0.9971 0.9954 565.79 Low Birth Weight -.1097773 -.5404714* .2795803 .1467784 -8.587054 5.010042 .1836783 30 0.6163 0.3818 2.63

Managerial Economics: Applications, Strategies and Tactics (MindTap Course List)
14th Edition
ISBN:9781305506381
Author:James R. McGuigan, R. Charles Moyer, Frederick H.deB. Harris
Publisher:James R. McGuigan, R. Charles Moyer, Frederick H.deB. Harris
Chapter4A: Problems In Applying The Linear Regression Model
Section: Chapter Questions
Problem 2E

Related questions
Question
How would you describe this data?
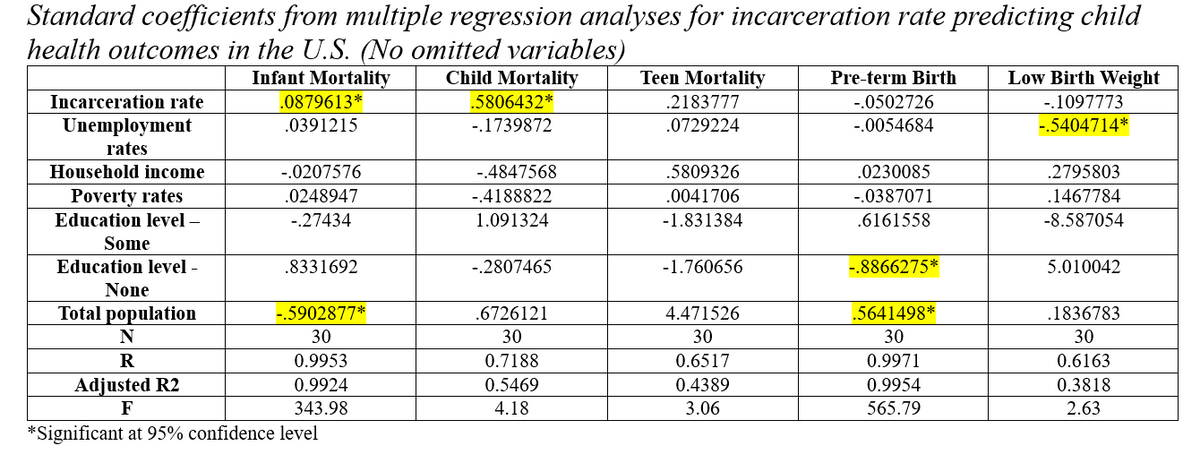
Transcribed Image Text:Standard coefficients from multiple regression analyses for incarceration rate predicting child
health outcomes in the U.S. (No omitted variables)
Infant Mortality
Child Mortality
Incarceration rate
Unemployment
rates
Household income
Poverty rates
Education level -
Some
Education level -
None
Total population
N
R
.0879613*
.0391215
-.0207576
.0248947
-.27434
.8331692
-.5902877*
30
0.9953
0.9924
343.98
Adjusted R2
F
*Significant at 95% confidence level
.5806432*
-.1739872
-.4847568
-.4188822
1.091324
-.2807465
.6726121
30
0.7188
0.5469
4.18
Teen Mortality
.2183777
.0729224
.5809326
.0041706
-1.831384
-1.760656
4.471526
30
0.6517
0.4389
3.06
Pre-term Birth
-.0502726
-.0054684
.0230085
-.0387071
.6161558
-.8866275*
.5641498*
30
0.9971
0.9954
565.79
Low Birth Weight
-.1097773
-.5404714*
.2795803
.1467784
-8.587054
5.010042
.1836783
30
0.6163
0.3818
2.63
Expert Solution
This question has been solved!
Explore an expertly crafted, step-by-step solution for a thorough understanding of key concepts.

This is a popular solution!

Trending now
This is a popular solution!

Step by step
Solved in 4 steps

Knowledge Booster


Learn more about
Need a deep-dive on the concept behind this application? Look no further. Learn more about this topic, economics and related others by exploring similar questions and additional content below.Recommended textbooks for you
Managerial Economics: Applications, Strategies an…
Economics
ISBN:
9781305506381
Author:
James R. McGuigan, R. Charles Moyer, Frederick H.deB. Harris
Publisher:
Cengage Learning
Managerial Economics: Applications, Strategies an…
Economics
ISBN:
9781305506381
Author:
James R. McGuigan, R. Charles Moyer, Frederick H.deB. Harris
Publisher:
Cengage Learning