State the null and alternative hypotheses to determine if the average number of hours until spoilage begins differs for the preservatives A and B. Assume population variances are equal. Calculate the pooled variance and the value of the test statistic. t: Determine the rejection region at a = .05 and write the proper conclusion. Rejection region: Decision: Conclusion:
State the null and alternative hypotheses to determine if the average number of hours until spoilage begins differs for the preservatives A and B. Assume population variances are equal. Calculate the pooled variance and the value of the test statistic. t: Determine the rejection region at a = .05 and write the proper conclusion. Rejection region: Decision: Conclusion:

Glencoe Algebra 1, Student Edition, 9780079039897, 0079039898, 2018
18th Edition
ISBN:9780079039897
Author:Carter
Publisher:Carter
Chapter10: Statistics
Section10.4: Distributions Of Data
Problem 19PFA

Related questions
Question
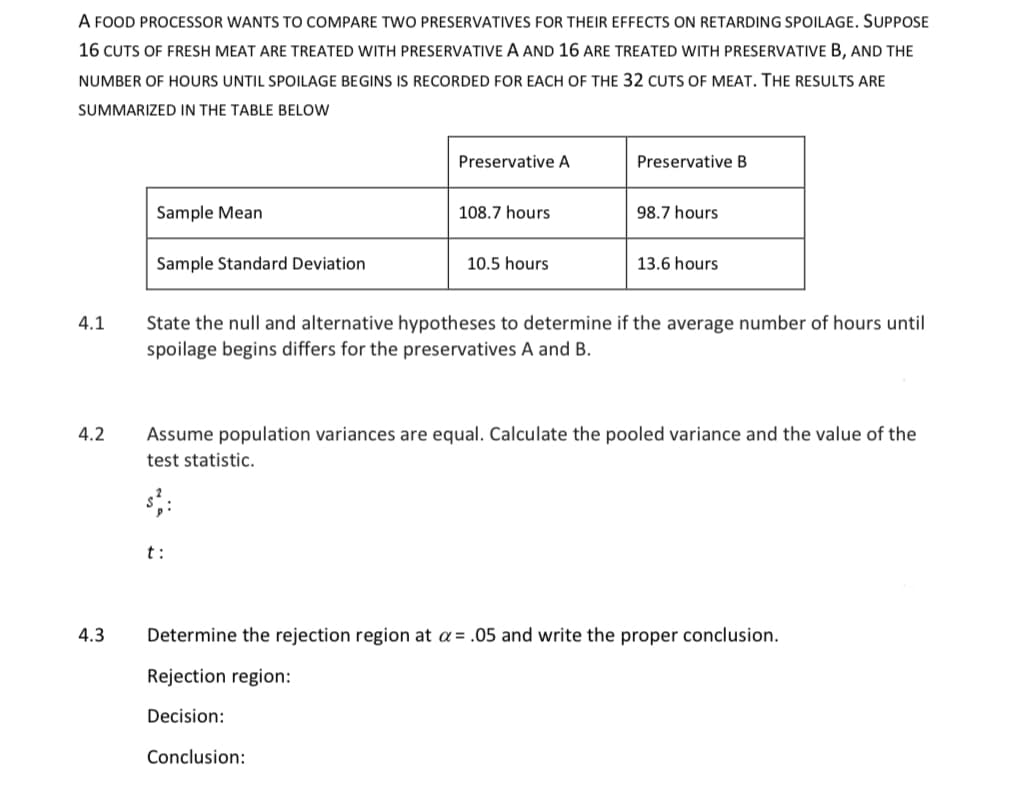
Transcribed Image Text:A FOOD PROCESSOR WANTS TO COMPARE TWO PRESERVATIVES FOR THEIR EFFECTS ON RETARDING SPOILAGE. SUPPOSE
16 CUTS OF FRESH MEAT ARE TREATED WITH PRESERVATIVE A AND 16 ARE TREATED WITH PRESERVATIVE B, AND THE
NUMBER OF HOURS UNTIL SPOILAGE BEGINS IS RECORDED FOR EACH OF THE 32 CUTS OF MEAT. THE RESULTS ARE
SUMMARIZED IN THE TABLE BELOW
4.1
4.2
4.3
Sample Mean
Sample Standard Deviation
Preservative A
108.7 hours
t:
10.5 hours
Preservative B
98.7 hours
13.6 hours
State the null and alternative hypotheses to determine if the average number of hours until
spoilage begins differs for the preservatives A and B.
Assume population variances are equal. Calculate the pooled variance and the value of the
test statistic.
Determine the rejection region at a= .05 and write the proper conclusion.
Rejection region:
Decision:
Conclusion:
Expert Solution
This question has been solved!
Explore an expertly crafted, step-by-step solution for a thorough understanding of key concepts.

Step by step
Solved in 4 steps with 2 images

Recommended textbooks for you
Glencoe Algebra 1, Student Edition, 9780079039897…
Algebra
ISBN:
9780079039897
Author:
Carter
Publisher:
McGraw Hill
Glencoe Algebra 1, Student Edition, 9780079039897…
Algebra
ISBN:
9780079039897
Author:
Carter
Publisher:
McGraw Hill