State whether the following statements are true or false and give a brief explanation. (Note that no marks will be given without explanation.) a) A research is conducted to study the relationship between two variables. The two variables are: (i) the occupations of employees, and (ii) the happiness scores of employees. It is noted that the occupation is at nominal level and the happiness score is at interval level. To perform the analysis, the chi-square test should be used. b) You are given that the coefficient of determination of two variables is 35%. So, it can be concluded that the slope of the regression line for the two variables is positive.
State whether the following statements are true or false and give a brief explanation. (Note that no marks will be given without explanation.) a) A research is conducted to study the relationship between two variables. The two variables are: (i) the occupations of employees, and (ii) the happiness scores of employees. It is noted that the occupation is at nominal level and the happiness score is at interval level. To perform the analysis, the chi-square test should be used. b) You are given that the coefficient of determination of two variables is 35%. So, it can be concluded that the slope of the regression line for the two variables is positive.

Glencoe Algebra 1, Student Edition, 9780079039897, 0079039898, 2018
18th Edition
ISBN:9780079039897
Author:Carter
Publisher:Carter
Chapter10: Statistics
Section10.3: Measures Of Spread
Problem 1GP

Related questions
Question
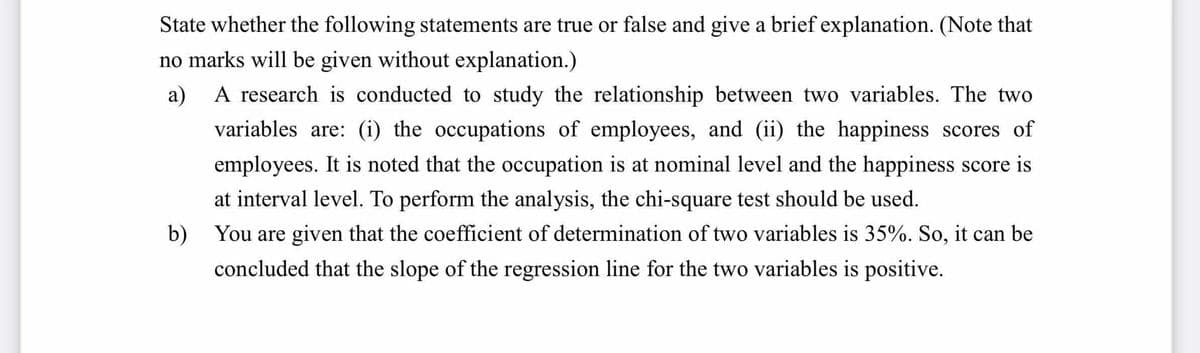
Transcribed Image Text:State whether the following statements are true or false and give a brief explanation. (Note that
no marks will be given without explanation.)
a) A research is conducted to study the relationship between two variables. The two
variables are: (i) the occupations of employees, and (ii) the happiness scores of
employees. It is noted that the occupation is at nominal level and the happiness score is
at interval level. To perform the analysis, the chi-square test should be used.
b)
You are given that the coefficient of determination of two variables is 35%. So, it can be
concluded that the slope of the regression line for the two variables is positive.
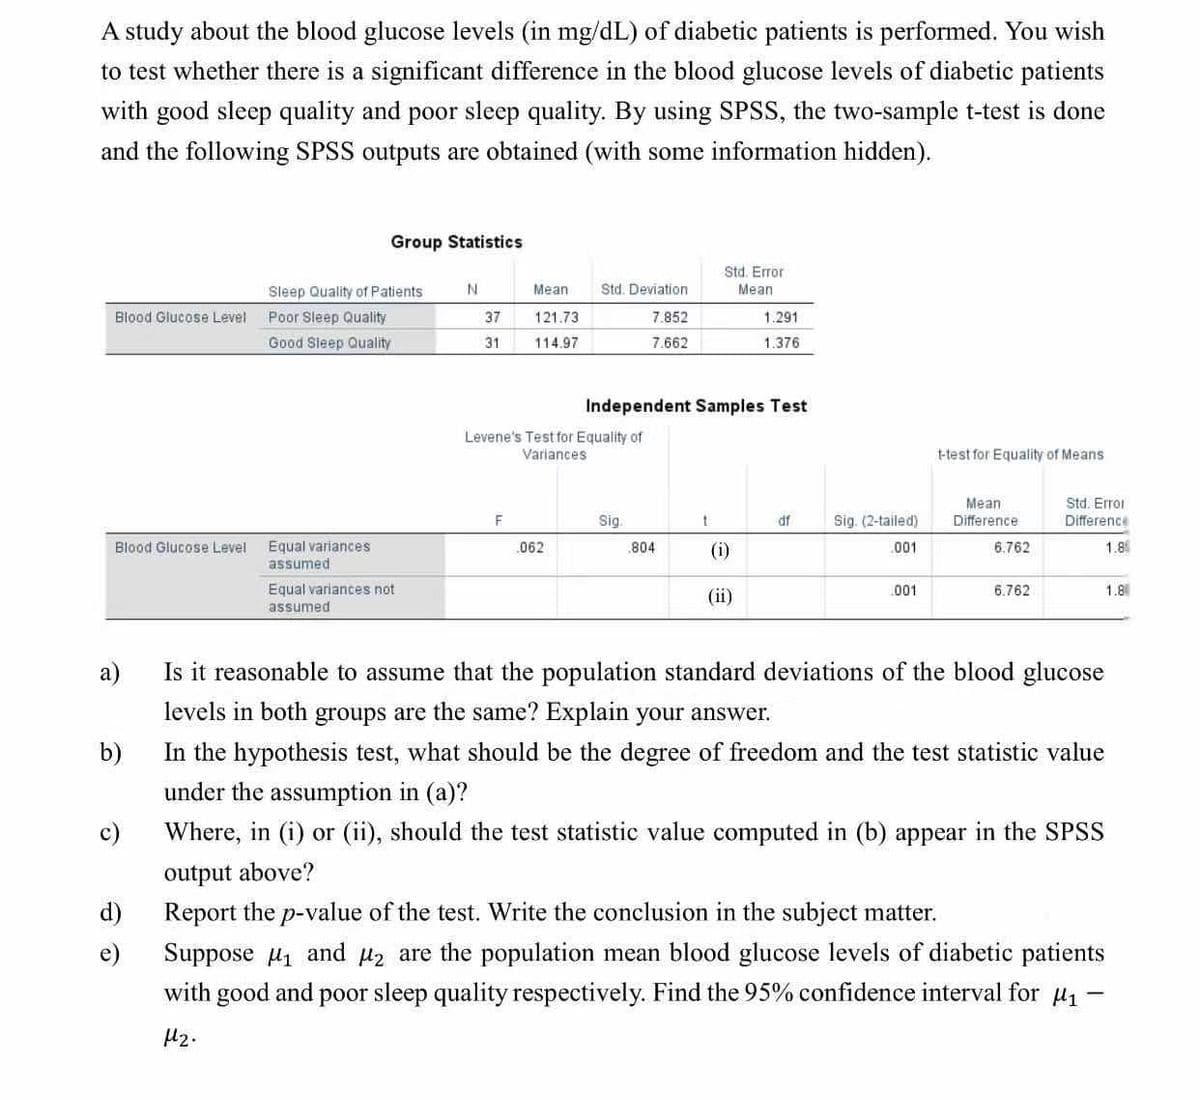
Transcribed Image Text:A study about the blood glucose levels (in mg/dL) of diabetic patients is performed. You wish
to test whether there is a significant difference in the blood glucose levels of diabetic patients
with good sleep quality and poor sleep quality. By using SPSS, the two-sample t-test is done
and the following SPSS outputs are obtained (with some information hidden).
Blood Glucose Level
Blood Glucose Level
c)
d)
e)
Group Statistics
Sleep Quality of Patients:
Poor Sleep Quality
Good Sleep Quality
Equal variances
assumed
Equal variances not
assumed
N
37
31
Meant
121.73
114.97
F
Std. Deviation
7.852
7.662
Levene's Test for Equality of
Variances
062
Independent Samples Test
Sig.
.804
Std. Error
Mean
t
(i)
1.291
1.376
(ii)
df
Sig. (2-tailed)
.001
.001
t-test for Equality of Means
Mean
Difference
6.762
6.762
Std. Error
Difference
1.8
a)
Is it reasonable to assume that the population standard deviations of the blood glucose
levels in both groups are the same? Explain your answer.
b)
In the hypothesis test, what should be the degree of freedom and the test statistic value
under the assumption in (a)?
Where, in (i) or (ii), should the test statistic value computed in (b) appear in the SPSS
output above?
Report the p-value of the test. Write the conclusion in the subject matter.
Suppose ₁ and ₂ are the population mean blood glucose levels of diabetic patients
with good and poor sleep quality respectively. Find the 95% confidence interval for μ₁
4₂.
1.8
-
Expert Solution
This question has been solved!
Explore an expertly crafted, step-by-step solution for a thorough understanding of key concepts.

Step by step
Solved in 3 steps

Recommended textbooks for you
Glencoe Algebra 1, Student Edition, 9780079039897…
Algebra
ISBN:
9780079039897
Author:
Carter
Publisher:
McGraw Hill

Holt Mcdougal Larson Pre-algebra: Student Edition…
Algebra
ISBN:
9780547587776
Author:
HOLT MCDOUGAL
Publisher:
HOLT MCDOUGAL
Glencoe Algebra 1, Student Edition, 9780079039897…
Algebra
ISBN:
9780079039897
Author:
Carter
Publisher:
McGraw Hill
Holt Mcdougal Larson Pre-algebra: Student Edition…
Algebra
ISBN:
9780547587776
Author:
HOLT MCDOUGAL
Publisher:
HOLT MCDOUGAL