Statement of financial position as at 31 December 2019 Notes 31 December 31 December 2019 2018 RO RO ASSETS Non-current assets Property, plant and equipment 5 14,352,670 15,813,557 Right-of-use asset 6 600,694 Fair value through other comprehensive income investments 2,228,707 1,757,086 Total non-current assets 17,182,071 17,570,643 Current assets Debt instruments at amortised cost 11,019,390 9,078,075 Inventories 9 4,661,428 5,374,929 Trade and other receivables 10 8,339,499 8,297,403 Cash and cash equivalents 11 1,480,732 25,501,049 800,314 Total current assets 23,550,721 Total assets 42,683, 120 41,121,364 EQUITY AND LIABILITIES Capital and reserves Share capital 12 29,621,368 29,621,368 Legal reserve 13 6,665,959 6,463,472 Retained earnings 2,052,872 2,007,775 Equity investment reserve (622,772) 37,717,427 (1,004,521) Total capital and reserves 37,088,094 Non-current liabilities Non-current portion of lease liabilities 6. 490,476 Employees' benefits liability 17 768,488 938,425 Deferred tax liability 25 399,110 393,303 Total non-current liabilities 1,658,074 1,331,728 Current liabilities Current portion of lease liabilities Trade and other payables 6 124,624 15 2,768,153 2,524,711 Income tax payable 25 414,842 176,831 Total current liabilities 3,307,619 2,701,542 Total equity and liabilities 42,683,120 41,121,364 Net assets per share (RO) 26 0.127 0.125
Statement of financial position as at 31 December 2019 Notes 31 December 31 December 2019 2018 RO RO ASSETS Non-current assets Property, plant and equipment 5 14,352,670 15,813,557 Right-of-use asset 6 600,694 Fair value through other comprehensive income investments 2,228,707 1,757,086 Total non-current assets 17,182,071 17,570,643 Current assets Debt instruments at amortised cost 11,019,390 9,078,075 Inventories 9 4,661,428 5,374,929 Trade and other receivables 10 8,339,499 8,297,403 Cash and cash equivalents 11 1,480,732 25,501,049 800,314 Total current assets 23,550,721 Total assets 42,683, 120 41,121,364 EQUITY AND LIABILITIES Capital and reserves Share capital 12 29,621,368 29,621,368 Legal reserve 13 6,665,959 6,463,472 Retained earnings 2,052,872 2,007,775 Equity investment reserve (622,772) 37,717,427 (1,004,521) Total capital and reserves 37,088,094 Non-current liabilities Non-current portion of lease liabilities 6. 490,476 Employees' benefits liability 17 768,488 938,425 Deferred tax liability 25 399,110 393,303 Total non-current liabilities 1,658,074 1,331,728 Current liabilities Current portion of lease liabilities Trade and other payables 6 124,624 15 2,768,153 2,524,711 Income tax payable 25 414,842 176,831 Total current liabilities 3,307,619 2,701,542 Total equity and liabilities 42,683,120 41,121,364 Net assets per share (RO) 26 0.127 0.125

Intermediate Accounting: Reporting And Analysis
3rd Edition
ISBN:9781337788281
Author:James M. Wahlen, Jefferson P. Jones, Donald Pagach
Publisher:James M. Wahlen, Jefferson P. Jones, Donald Pagach
Chapter12: Intangibles
Section: Chapter Questions
Problem 10MC

Related questions
Question
interpret the results of quick ratio, debt ratio, equity multiplier and explain what that mean for the perfomance of an organization.
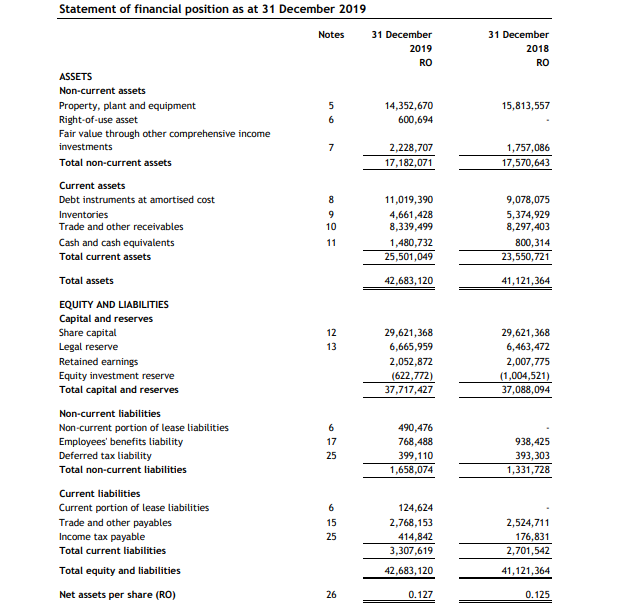
Transcribed Image Text:Statement of financial position as at 31 December 2019
Notes
31 December
31 December
2019
2018
RO
RO
ASSETS
Non-current assets
Property, plant and equipment
5
14,352,670
15,813,557
Right-of-use asset
6
600,694
Fair value through other comprehensive income
investments
7
2,228,707
1,757,086
Total non-current assets
17,182,071
17,570,643
Current assets
Debt instruments at amortised cost
8
11,019,390
9,078,075
Inventories
9.
4,661,428
5,374,929
8,297,403
Trade and other receivables
10
8,339,499
800,314
23,550,721
Cash and cash equivalents
11
1,480,732
25,501,049
Total current assets
Total assets
42,683,120
41,121,364
EQUITY AND LIABILITIES
Capital and reserves
Share capital
12
29,621,368
29,621,368
Legal reserve
13
6,665,959
6,463,472
Retained earnings
2,052,872
2,007,775
Equity investment reserve
(1,004,521)
(622,772)
37,717,427
Total capital and reserves
37,088,094
Non-current liabilities
Non-current portion of lease liabilities
6
490,476
Employees' benefits liability
17
768,488
399,110
938,425
Deferred tax liability
25
393,303
Total non-current liabilities
1,658,074
1,331,728
Current liabilities
Current portion of lease liabilities
6
124,624
Trade and other payables
15
2,768,153
2,524,711
Income tax payable
25
414,842
176,831
Total current liabilities
3,307,619
2,701,542
Total equity and liabilities
42,683, 120
41,121,364
Net assets per share (RO)
26
0.127
0.125
Expert Solution
This question has been solved!
Explore an expertly crafted, step-by-step solution for a thorough understanding of key concepts.

Step by step
Solved in 3 steps

Knowledge Booster


Learn more about
Need a deep-dive on the concept behind this application? Look no further. Learn more about this topic, accounting and related others by exploring similar questions and additional content below.Recommended textbooks for you
Intermediate Accounting: Reporting And Analysis
Accounting
ISBN:
9781337788281
Author:
James M. Wahlen, Jefferson P. Jones, Donald Pagach
Publisher:
Cengage Learning

Cornerstones of Financial Accounting
Accounting
ISBN:
9781337690881
Author:
Jay Rich, Jeff Jones
Publisher:
Cengage Learning
Intermediate Accounting: Reporting And Analysis
Accounting
ISBN:
9781337788281
Author:
James M. Wahlen, Jefferson P. Jones, Donald Pagach
Publisher:
Cengage Learning
Cornerstones of Financial Accounting
Accounting
ISBN:
9781337690881
Author:
Jay Rich, Jeff Jones
Publisher:
Cengage Learning