Statistical Software Section Directions: Please use statistical software to make all the calculations. For parts a) – e) there will be no hand calculations. Please provide all statistical output with this section. 15) The following table gives the total 2004 payroll (on opening day of the season, rounded to the nearest million dollars) and the percentage of games won during the 2004 season by each of the American League teams. Total Payroll |(millions of $) Percentage Winning Team Angels 101 56.8 Orioles 52 48.1 Red Sox 127 60.5 White Sox 65 51.2 Indians 34 49.4 44.4 Tigers Royals 47 48 35.8 Twins 54 56.8 Yankees 184 62.3 Athletics Mariners Devil Rays Rangers Blue Jays 59 56.2 82 38.9 30 43.5 55 54.9 50 41.6 a. Calculate the sample correlation coefficient and interpret. b. Test at the 5% significance level whether there is a positive correlation between payroll and wining percentage for the American League teams. Please set-up the null and alternative hypothesis, state the p-value, provide decision rule, and make your conclusion. c. Calculate the least-squares regression model, provide a scatterplot that includes the regression line. Provide this statistical output and interpret the slope. d. Test at the 5% significance level whether payroll is a good predictor of wining percentage for the American League teams. Please set-up the null and alternative hypothesis, state the p-value, provide decision rule, and make your conclusion. e. What is the coefficient of determination r?? Interpret! f. Calculate an approximate 95% confidence interval for B1. There will be some hand-calculations with this problem. Write a sentence that interprets this interval.
Statistical Software Section Directions: Please use statistical software to make all the calculations. For parts a) – e) there will be no hand calculations. Please provide all statistical output with this section. 15) The following table gives the total 2004 payroll (on opening day of the season, rounded to the nearest million dollars) and the percentage of games won during the 2004 season by each of the American League teams. Total Payroll |(millions of $) Percentage Winning Team Angels 101 56.8 Orioles 52 48.1 Red Sox 127 60.5 White Sox 65 51.2 Indians 34 49.4 44.4 Tigers Royals 47 48 35.8 Twins 54 56.8 Yankees 184 62.3 Athletics Mariners Devil Rays Rangers Blue Jays 59 56.2 82 38.9 30 43.5 55 54.9 50 41.6 a. Calculate the sample correlation coefficient and interpret. b. Test at the 5% significance level whether there is a positive correlation between payroll and wining percentage for the American League teams. Please set-up the null and alternative hypothesis, state the p-value, provide decision rule, and make your conclusion. c. Calculate the least-squares regression model, provide a scatterplot that includes the regression line. Provide this statistical output and interpret the slope. d. Test at the 5% significance level whether payroll is a good predictor of wining percentage for the American League teams. Please set-up the null and alternative hypothesis, state the p-value, provide decision rule, and make your conclusion. e. What is the coefficient of determination r?? Interpret! f. Calculate an approximate 95% confidence interval for B1. There will be some hand-calculations with this problem. Write a sentence that interprets this interval.

Functions and Change: A Modeling Approach to College Algebra (MindTap Course List)
6th Edition
ISBN:9781337111348
Author:Bruce Crauder, Benny Evans, Alan Noell
Publisher:Bruce Crauder, Benny Evans, Alan Noell
ChapterP: Prologue: Calculator Arithmetic
Section: Chapter Questions
Problem 2E: Pet Owners According to the Humane Society, in 2015, 65% of U.S. households owned at least one pet,...

Related questions
Question
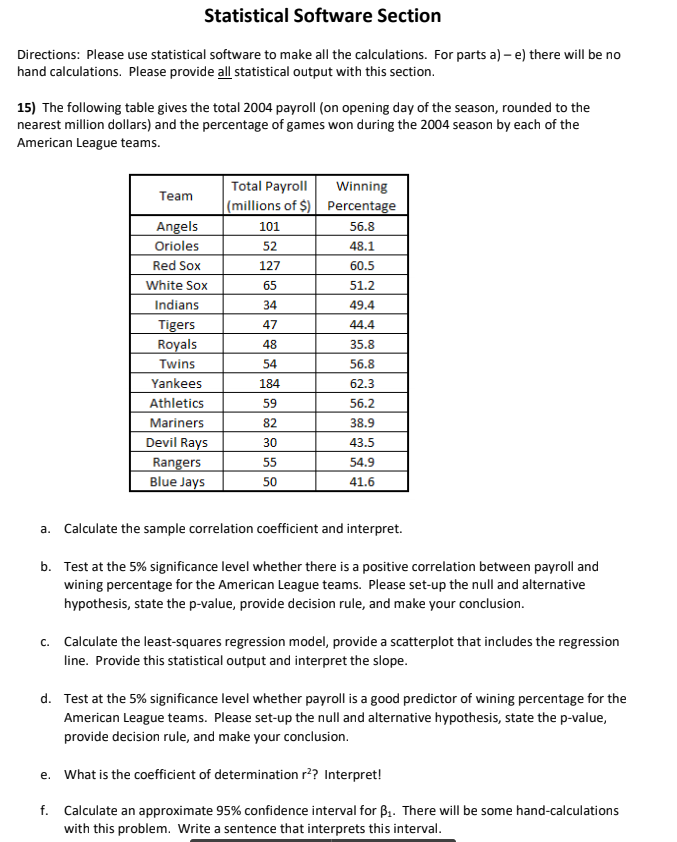
Transcribed Image Text:Statistical Software Section
Directions: Please use statistical software to make all the calculations. For parts a) – e) there will be no
hand calculations. Please provide all statistical output with this section.
15) The following table gives the total 2004 payroll (on opening day of the season, rounded to the
nearest million dollars) and the percentage of games won during the 2004 season by each of the
American League teams.
Total Payroll
|(millions of $) Percentage
Winning
Team
Angels
101
56.8
Orioles
52
48.1
Red Sox
127
60.5
White Sox
65
51.2
Indians
34
49.4
44.4
Tigers
Royals
47
48
35.8
Twins
54
56.8
Yankees
184
62.3
Athletics
Mariners
Devil Rays
Rangers
Blue Jays
59
56.2
82
38.9
30
43.5
55
54.9
50
41.6
a. Calculate the sample correlation coefficient and interpret.
b. Test at the 5% significance level whether there is a positive correlation between payroll and
wining percentage for the American League teams. Please set-up the null and alternative
hypothesis, state the p-value, provide decision rule, and make your conclusion.
c. Calculate the least-squares regression model, provide a scatterplot that includes the regression
line. Provide this statistical output and interpret the slope.
d. Test at the 5% significance level whether payroll is a good predictor of wining percentage for the
American League teams. Please set-up the null and alternative hypothesis, state the p-value,
provide decision rule, and make your conclusion.
e. What is the coefficient of determination r?? Interpret!
f. Calculate an approximate 95% confidence interval for B1. There will be some hand-calculations
with this problem. Write a sentence that interprets this interval.
Expert Solution
This question has been solved!
Explore an expertly crafted, step-by-step solution for a thorough understanding of key concepts.

This is a popular solution!

Trending now
This is a popular solution!

Step by step
Solved in 2 steps with 4 images

Recommended textbooks for you
Functions and Change: A Modeling Approach to Coll…
Algebra
ISBN:
9781337111348
Author:
Bruce Crauder, Benny Evans, Alan Noell
Publisher:
Cengage Learning

Big Ideas Math A Bridge To Success Algebra 1: Stu…
Algebra
ISBN:
9781680331141
Author:
HOUGHTON MIFFLIN HARCOURT
Publisher:
Houghton Mifflin Harcourt
Functions and Change: A Modeling Approach to Coll…
Algebra
ISBN:
9781337111348
Author:
Bruce Crauder, Benny Evans, Alan Noell
Publisher:
Cengage Learning
Big Ideas Math A Bridge To Success Algebra 1: Stu…
Algebra
ISBN:
9781680331141
Author:
HOUGHTON MIFFLIN HARCOURT
Publisher:
Houghton Mifflin Harcourt