Statistics 2 - Chapter 11 Project 1 Two new assembly methods are tested and the variances in assembly times are reported. Is variance in Method A more than Method B. Use a .05 level of significance. Sample Size Sample Variance Show all six steps of hypothesis testing. Method A 31 25 Method 26 12
Statistics 2 - Chapter 11 Project 1 Two new assembly methods are tested and the variances in assembly times are reported. Is variance in Method A more than Method B. Use a .05 level of significance. Sample Size Sample Variance Show all six steps of hypothesis testing. Method A 31 25 Method 26 12

Glencoe Algebra 1, Student Edition, 9780079039897, 0079039898, 2018
18th Edition
ISBN:9780079039897
Author:Carter
Publisher:Carter
Chapter10: Statistics
Section10.5: Comparing Sets Of Data
Problem 29PFA

Related questions
Question
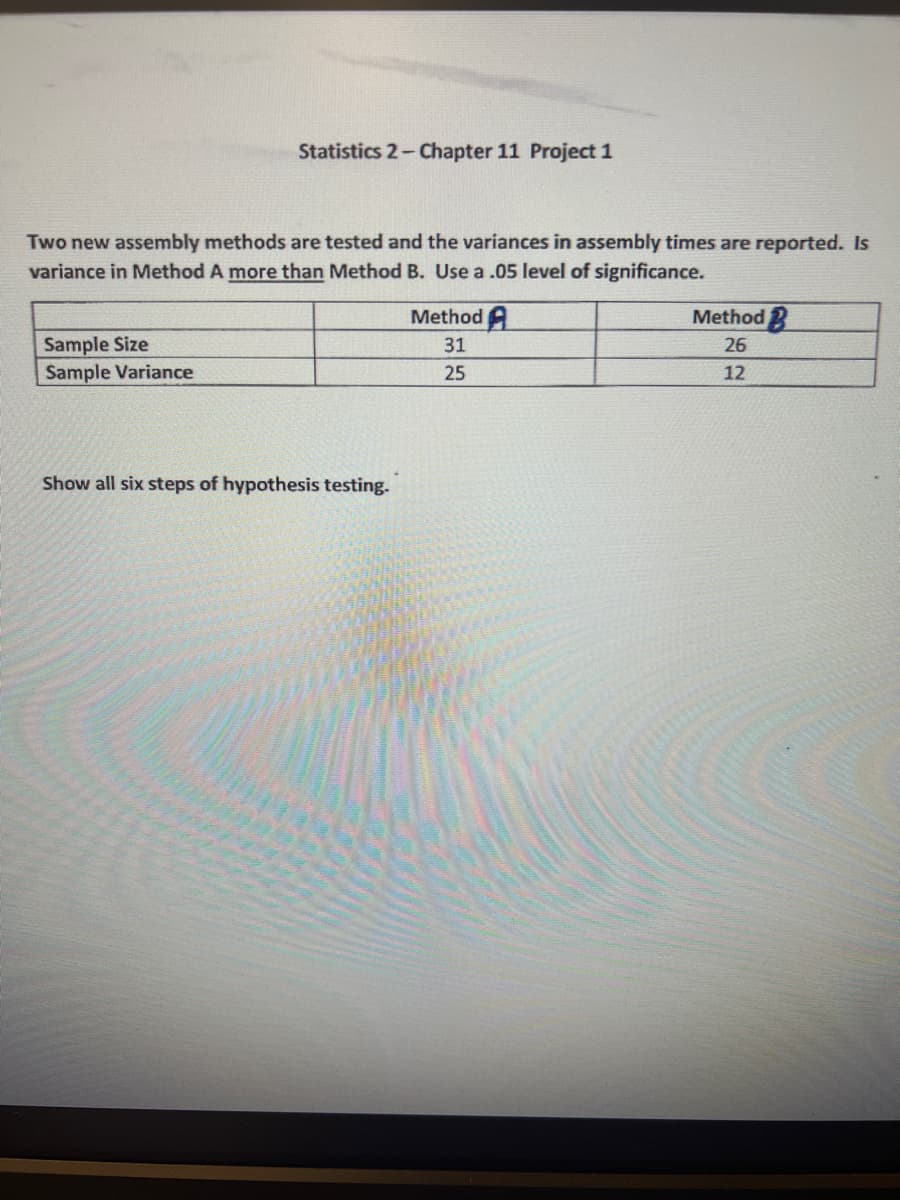
Transcribed Image Text:Statistics 2-Chapter 11 Project 1
Two new assembly methods are tested and the variances in assembly times are reported. Is
variance in Method A more than Method B. Use a .05 level of significance.
Sample Size
Sample Variance
Show all six steps of hypothesis testing.
MethodA
31
25
Method
26
12
Expert Solution
This question has been solved!
Explore an expertly crafted, step-by-step solution for a thorough understanding of key concepts.

This is a popular solution!

Trending now
This is a popular solution!

Step by step
Solved in 2 steps with 1 images

Recommended textbooks for you
Glencoe Algebra 1, Student Edition, 9780079039897…
Algebra
ISBN:
9780079039897
Author:
Carter
Publisher:
McGraw Hill

Functions and Change: A Modeling Approach to Coll…
Algebra
ISBN:
9781337111348
Author:
Bruce Crauder, Benny Evans, Alan Noell
Publisher:
Cengage Learning
Glencoe Algebra 1, Student Edition, 9780079039897…
Algebra
ISBN:
9780079039897
Author:
Carter
Publisher:
McGraw Hill
Functions and Change: A Modeling Approach to Coll…
Algebra
ISBN:
9781337111348
Author:
Bruce Crauder, Benny Evans, Alan Noell
Publisher:
Cengage Learning