When analyzing quantitative distributions, you should look for which of the following characteristics: O shape, outliers, center/typical value, variability O mode and variability/diversity O shape, median, and variability Oshape, mean, variability
When analyzing quantitative distributions, you should look for which of the following characteristics: O shape, outliers, center/typical value, variability O mode and variability/diversity O shape, median, and variability Oshape, mean, variability

Glencoe Algebra 1, Student Edition, 9780079039897, 0079039898, 2018
18th Edition
ISBN:9780079039897
Author:Carter
Publisher:Carter
Chapter10: Statistics
Section: Chapter Questions
Problem 25SGR

Related questions
Question
31
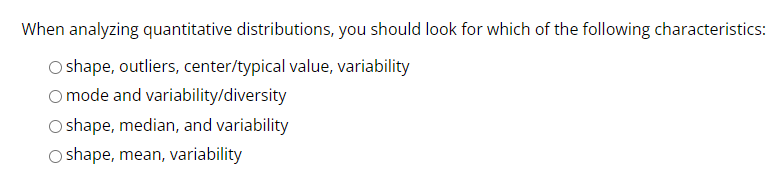
Transcribed Image Text:When analyzing quantitative distributions, you should look for which of the following characteristics:
O shape, outliers, center/typical value, variability
O mode and variability/diversity
O shape, median, and variability
Oshape, mean, variability
Expert Solution
This question has been solved!
Explore an expertly crafted, step-by-step solution for a thorough understanding of key concepts.

Step by step
Solved in 2 steps

Recommended textbooks for you
Glencoe Algebra 1, Student Edition, 9780079039897…
Algebra
ISBN:
9780079039897
Author:
Carter
Publisher:
McGraw Hill
Glencoe Algebra 1, Student Edition, 9780079039897…
Algebra
ISBN:
9780079039897
Author:
Carter
Publisher:
McGraw Hill