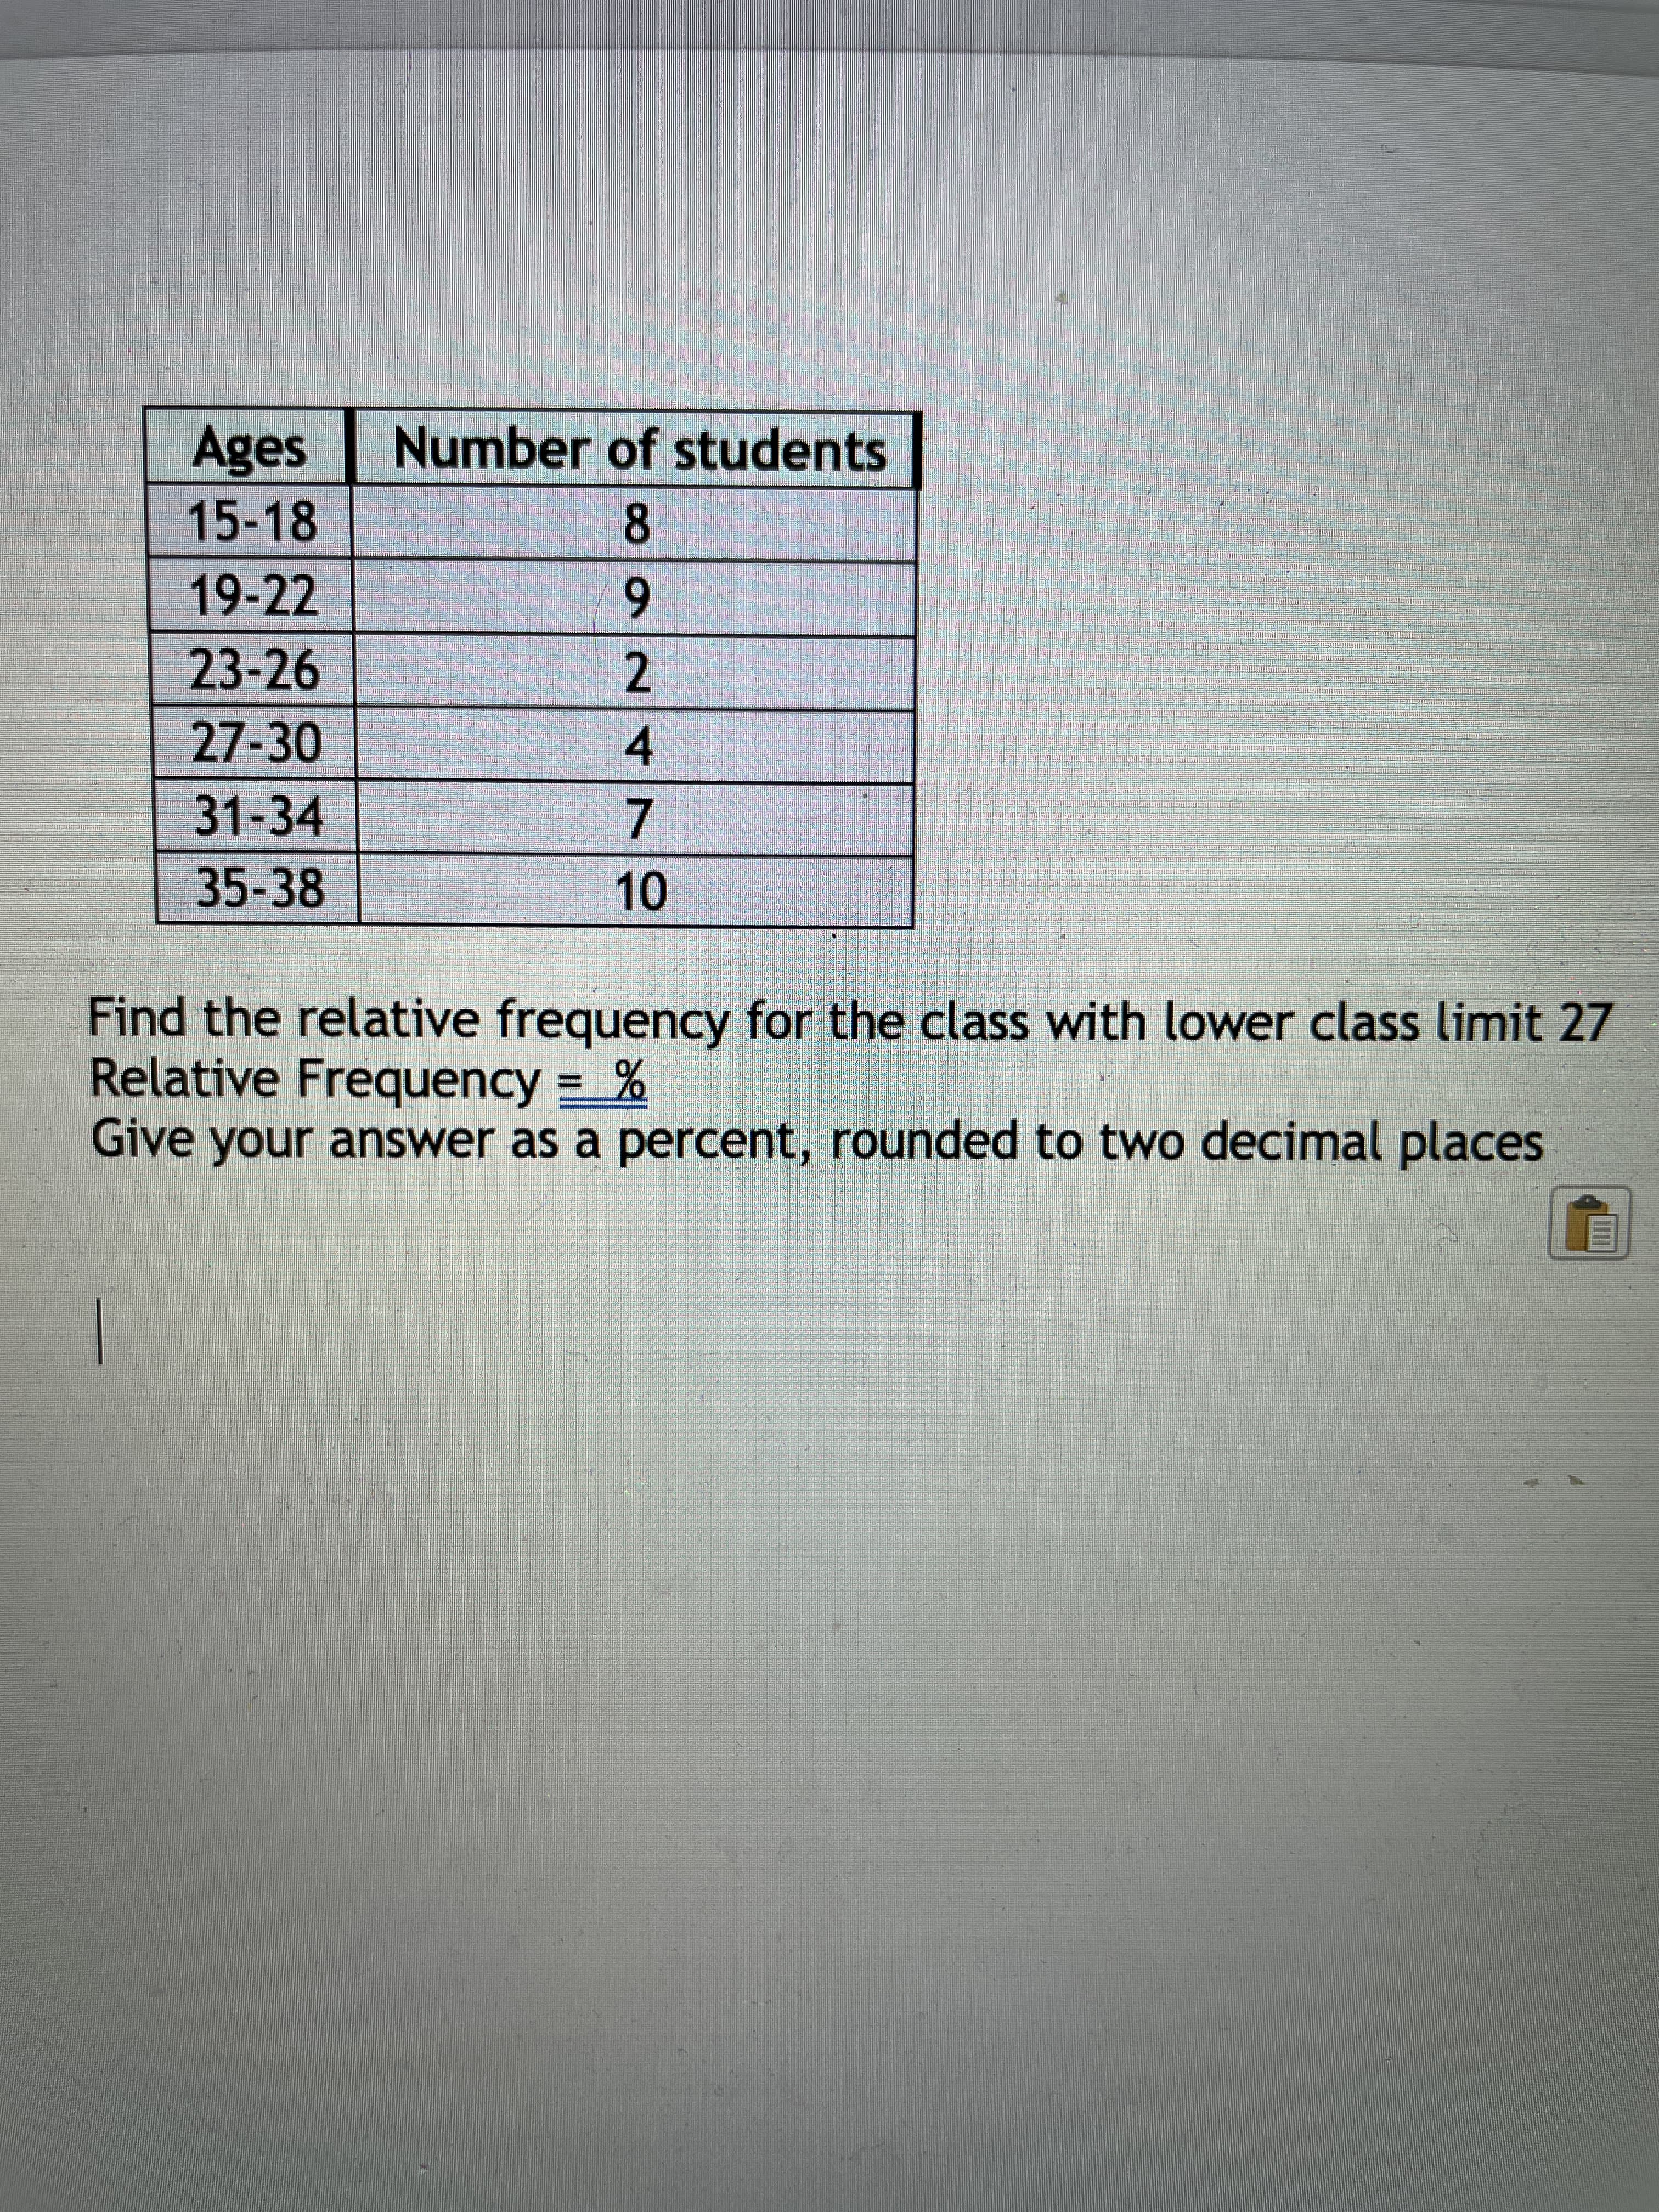
- Ages Number of students 15-18 6. 2 19-22 23-26 27-30 4. 31-34 7. 35-38 Find the relative frequency for the class with lower class limit 27 Relative Frequency = % Give your answer as a percent, rounded to two decimal places


Q: A Consumer Price Index (CPI) is a statistical estimate constructed using the prices of a sample of…
A: From the given information we find correct Option.
Q: ges Number of students 15-18 5 19-22 8 23-26 10 27-30 8 31-34 8 35-38 10 Based on the frequency…
A: Ages Number of students 15-18 5 19-22 8 23-26 10 27-30 8 31-34 8 35-38 10 total n =…
Q: Ages Number of students 15-18 7 19-22 2 23-26 10 27-30 7 31-34 2 35-38 2 Based on the frequency…
A:
Q: Ages Number of students 15-18 19-22 6 23-26 10 27-30 4 31-34 5 35-38 6 Based on the frequency…
A: Ages NUMBER OF STUDENTS 15-18 5 19-22…
Q: Ages Number of students 15-18 4. 19-22 10 23-26 10 27-30 31-34 35-38 Based on the frequency…
A: From the given table, The total frequency is 4+10+10+6+8+5=43 The frequency value for the class with…
Q: Ages Number of students 15-18 7 19-22 9. 23-26 27-30 31-34 8 35-38 9. Based on the frequency…
A: Frequency Distribution: In Statistical theory, a frequency distribution is a tabular, listed or…
Q: Ages Number of students 15-18 7 19-22 7 23-26 2 27-30 4 31-34 9 35-38 8 Find the relative frequency…
A:
Q: Ages Number of students 15-18 7 19-22 10 23-26 4 27-30 2 31-34 7 35-38 5 Based on the frequency…
A:
Q: 50 part-time students were asked how many courses they were taking this term. The (incomplete)…
A: From the given information, # of courses Frequency Relative Frequency=frequency/Total frequency…
Q: Class 80-82 frequency 5, class 83-85 frequency 4, class 86-88 frequency 8, 89-91 10, 92-94 3 A.…
A: Solution
Q: Ages Number of students 15-18 19-22 23-26 27-30 31-34 35-38 Based on the frequency distribution…
A: We know that Relative frequency = each frequency/ total number of frequency
Q: Ages Number of students 15-18 2 19-22 4 23-26 3 27-30 7 31-34 6 35-38 10 Based on the frequency…
A: Solution-: We have following table: Ages # of students 15-18 2 19-22 4 23-26 3 27-30 7…
Q: Ages Number of students 15-18 5 19-22 9 23-26 2 27-30 10 31-34 10 35-38 2 Find the…
A:
Q: Ages Number of students 15-18 19-22 23-26 10 27-30 31-34 35-38 10 Based on the frequency…
A:
Q: Ages Number of students 15-18 10 19-22 6 23-26 4 27-30 5 31-34 5 35-38 4 Based on the frequency…
A: Given that the frequency distribution table: Ages Number of students 15-18 10 19-22 6 23-26…
Q: Age of Customers Who Prefer Smile Bright Toothpaste. 20- 16- 10 20 30 40 50 60 70 Age (in Years)…
A: From the histogram, the frequency distribution table is Class Interval Frequency 0-10 4 10-20…
Q: Fifty part-time students were asked how many courses they were taking this term. The (Incomplete)…
A:
Q: Ages Number of students Relative Frequency 15-18 9 % 19-22 2 % 23-26 2 % 27-30 6 % 31-34 3 % 35-38 6…
A: Relative frequency = frequencyTotal Frequency
Q: The following are the P/E ratios (price of stock divided by projected earnings per share) for 15…
A:
Q: Ages Number of students 15-18 5 19-22 3 23-26 8 27-30 8 31-34 3 35-38 9 Based on the…
A: A relative frequency is the percentage of frequency according to the classes. It can be calculated…
Q: Ages Number of students 15-18 10 19-22 8 23-26 10 27-30 2 31-34 6 35-38 7 Based on the frequency…
A: Given data, Find relative frequency for class with lower limit 15.
Q: Ages Number of students 15-18 3 19-22 4 23-26 2 27-30 7 31-34 2 35-38 8 Based on the frequency…
A: Relative frequency: Relative frequency of a class is the ratio of number of occurrences of a class…
Q: Ages Number of students 15-18 3 19-22 9 23-26 8 27-30 3 31-34 7 35-38 7 Find the relative frequency…
A: Given that, Ages Number of students 15-18 3 19-22 9 23-26 8 27-30 3 31-34 7 35-38 7…
Q: b. Complete the table. Enter the exact answers (i.e. enter your answers for the relative and…
A: Frequency total = 3+8+9+4+1=25 Relative frequency = Frequency of the class Frequency total…
Q: Students on a campus of a college in Wisconsin were asked about their age. The results of this…
A:
Q: Ages Number of students 15-18 19-22 23-26 27-30 4. 31-34 35-38 Based on the frequency distribution…
A: Given data, Find relative frequency for class 15-18
Q: Ages Number of students 15-18 5 19-22 5 23-26 9 27-30 4 31-34 2 35-38 3 Find the relative…
A:
Q: Find frequency histogram, frequency polygon, frequency Cumulative Curve ( less than) and percentage…
A:
Q: Ages Number of students 15-18 19-22 23-26 27-30 31-34 35-38 Based on the frequency distribution…
A: Given, Age number of student 15-18 2 19-22 7 23-26 4 27-30 4 31-34 2 35-38 3 total…
Q: Ages Number of students 15-18 7 19-22 8 23-26 6 27-30 3 31-34 2 35-38 10 Based on the frequency…
A:
Q: Ages Number of students 15-18 4 19-22 7 23-26 3 27-30 6 31-34 2 35-38 6 Find the…
A: Given data table is,AgesNumber of students15-18419-22723-26327-30631-34235-386
Q: Ages Number of students 15-18 8. 19-22 7. 23-26 27-30 8 8. 31-34 35-38 3 5 Based on the frequency…
A:
Q: b. Complete the table. Enter the exact answers (i.e. enter your answers for the relative and…
A: Given that Frequency distribution # of movies Frequency 0 5 1 6 2 4 3 5 4 1
Q: Identify the type of observational study (cross-sectional, retrospective, or prospective) described…
A: A study that collects and investigates the individual before the development of any habits or…
Q: Ages Number of students 15-18 6 19-22 4 23-26 5 27-30 2 31-34 6 35-38 7 Find the relative frequency…
A:
Q: Students on a campus of a college in Wisconsin were asked about their age. The results of this…
A: Here,the total frequency is 44+28+11+33=116 a.)The relative frequency for the age group 17-26 is…
Q: Ages Number of students 15-18 3 19-22 9 23-26 4 27-30 4 31-34 9 35-38 3 Find the relative frequency…
A: The given frequency distribution is as follows:
Q: Ages Number of students 15-18 6 19-22 7 23-26 7 27-30 6 31-34 4 35-38 2 Find the relative…
A: Given Ages Number of students 15-18 6 19-22 7 23-26 7 27-30 6 31-34 4 35-38 2 Find…
Q: Students on a campus of a college in Wisconsin were asked about their age. The results of this…
A: Given Data: Relative Frequency= Frequency of the group/ Total Frequency Student Ages Frequency…
Q: Ages Number of students 15-18 4 19-22 5 23-26 6 27-30 7 31-34 4 35-38 10 Based on the…
A: Cumulative Frequency:
Q: Ages Number of students 15-18 9 19-22 23-26 27-30 31-34 35-38 8 Based on the frequency distribution…
A: The formula for relative frequency distribution is,
Q: Ages Number of students 15-18 2 19-22 10 23-26 5 27-
A: Ages Number of students 15-18 2 19-22 10 23-26 5 27-30 4 31-34 5 35-38 3
Q: Find frequency histogram, frequency polygon, frequency Cumulative Curve ( less than) and percentage…
A:
Q: Ages Number of students 15-18 4 19-22 3 23-26 8 27-30 2 31-34 6 35-38 9 Based on the frequency…
A:
Q: Could you please tell me if my work is correct? Forbes magazine published data on the best small…
A:
Q: Ages Number of students 15-18 19-22 23-26 10 27-30 2. 31-34 3 35-38 10 Based on the frequency…
A: In grouped data, observations are clustered into groups. The groups and the corresponding…
Q: Number of students Ages 15-18 2 19-22 4 23-26 27-30 31-34 3 35-38 7 Based on the frequency…
A: Given data is Ages Number of students 15-18 2 19-22 4 23-26 5 27-30 6 31-34 3 35-38 7…
Q: b. Complete the table. Enter the exact answers (i.e. enter your answers for the relative and…
A: We have given the table with Movies and there absolute frequencies. We have to find the relative…
Q: Ages Number of students 15-18 8 19-22 23-26 7 27-30 31-34 6 35-38 3 Based on the frequency…
A: We have to find given cumulative frequency..
Q: 3. The data set shown below has an outlier. Determine the outlier and then answer the questions as…
A: 3. Median Decrease. As median is depends upon the number of observations, if we removed one…


Trending now
This is a popular solution!

Step by step
Solved in 2 steps

- What is the most frequent number of over-the-limit items for this data set? ans = What is the frequency of the most frequent number of over-the-limit items? ans =What is the lower class limit for the interval 76-80? Ara's grade is the 80th percentile, in which class interval she belongs?How likely it is that a mean from a particular sample is representative of the population is defined as: t-score F-statistic z-score p-value
- Identify the lower class limits, upper-class limits, class width, class midpoints, and class boundaries for the given frequency distribution. Also, identify the number of individuals included in the summary. (Type integers or decimals. Do not round. Use ascending order.) Age (yr) when award was won Frequency 10-19 28 20-29 36 30-39 15 40-49 3 50-59 4 60-69 1 70-79 2The economic dynamism, which is the index of productive growth in dollars for countries that are designated by the World Bank as middle-income are in table #7.3.8 ("SOCR data 2008," 2013). Countries that are considered high-income have a mean economic dynamism of 60.29. Do the data show that the mean economic dynamism of middle-income countries is less than the mean for high-income countries? Test at the 5% level. Table #7.3.8: Economic Dynamism of Middle Income Countries 25.8057 37.4511 51.915 43.6952 47.8506 43.7178 58.0767 41.1648 38.0793 37.7251 39.6553 42.0265 48.6159 43.8555 49.1361 61.9281 41.9543 44.9346 46.0521 48.3652 43.6252 50.9866 59.1724 39.6282 33.6074 21.6643The relative frequency associated with a particular class in the population is the fraction of measurements in the population falling in that class. True False
- The distribution of the arrival times of students coming to Chemistry class late is not normally distributed. A sample of 33 students is taken, with mean, μ=3.2 and standard deviation, σ=8.4. Is Central Limit Theorem applicable in the following cases? Explain why.11. A company manufacturers batteries in batches of 29 and there is a 3% rate of defects. Find the mean number of defects per batch. Show work.As a data collection specialist at the Centers for Disease Control and Prevention. you have been involved in a research study conducted over the past year. The study found that liver cancer rates per 100, 000 males among cigarette smokers versus nonsmokers in a major city were 58.0 to 25.4, respectively. 1) Using the data above, calculate the relative risk of males developing liver ter for smokers as compared to nonsmokers (round to two decimal places). 2)Create a pie chart to display the risks between the two groups presented. Include characteristics of good graphic design with appropriate labels and titles.
- An appliance company measured customer satisfaction among a randomly selected group of customers who had recently purchased a new dishwasher (n = 20) using a scale from 1 to 5, with 1 equal to a low level of satisfaction and 5 equal to a high level of satisfaction. The results are listed below. 1, 1, 1, 1, 2, 2, 3, 3, 3, 3, 3, 3, 4, 4, 4, 4, 5, 5, 5, 5 Describe, in detail, the appropriate frequency distribution graph for the provided data.Scenario: Is there a relationship between amount of time at a job (X) and productivity (Y)? The researcher quantified amount of time at a job by ranking the employees from those who had been there the least amount of time to the most. The researcher quantified productivity as rating the employees from "best" to "worst". Question: What is the most appropriate statistical test to conduct given this scenario? Pearson's r correlation Spearman correlation Point Biserial correlation Phi correlation9.) Look back at the information in the previous question, but assume that you will use 35 samplings to avoid violating the needed assumption to use the central limit theorem. What is the probability of getting a mean evaluation greater than 8? Previous question: 8.) Suppose that Miller Beer samples peopleís perceptions of the quality of Old Milwaukee beer. Respondents are asked to evaluate the beer on a scale of 1 to 10. The modal response is a 9 amongst sampled WisconsinBros, while the mean is 7.7 with a standard deviation of 2. Suppose you conduct 27 samplings to generate your point estimate of 7.7 as the mean evaluation of Old Milwaukee beer. If you want to use the central limittheorem to evaluate the likelihood that the next sampling will generate a mean evaluation greater than 8.0 which of the three assumptions is clearly violated and why (Hint: If you donít think itís the independent oridentical assumption, then it must be the normality assumption)?
