Compute the Pearson's sample correlation r, if you have the following values: Σχ40, Σχ350, Σy = 330, Ey; 330, Σ Ey = 30100, Ex;y; = 2050, n = 8 Σχ %3D8 %3D %3D %3D
Compute the Pearson's sample correlation r, if you have the following values: Σχ40, Σχ350, Σy = 330, Ey; 330, Σ Ey = 30100, Ex;y; = 2050, n = 8 Σχ %3D8 %3D %3D %3D

Glencoe Algebra 1, Student Edition, 9780079039897, 0079039898, 2018
18th Edition
ISBN:9780079039897
Author:Carter
Publisher:Carter
Chapter10: Statistics
Section10.5: Comparing Sets Of Data
Problem 14PPS

Related questions
Question
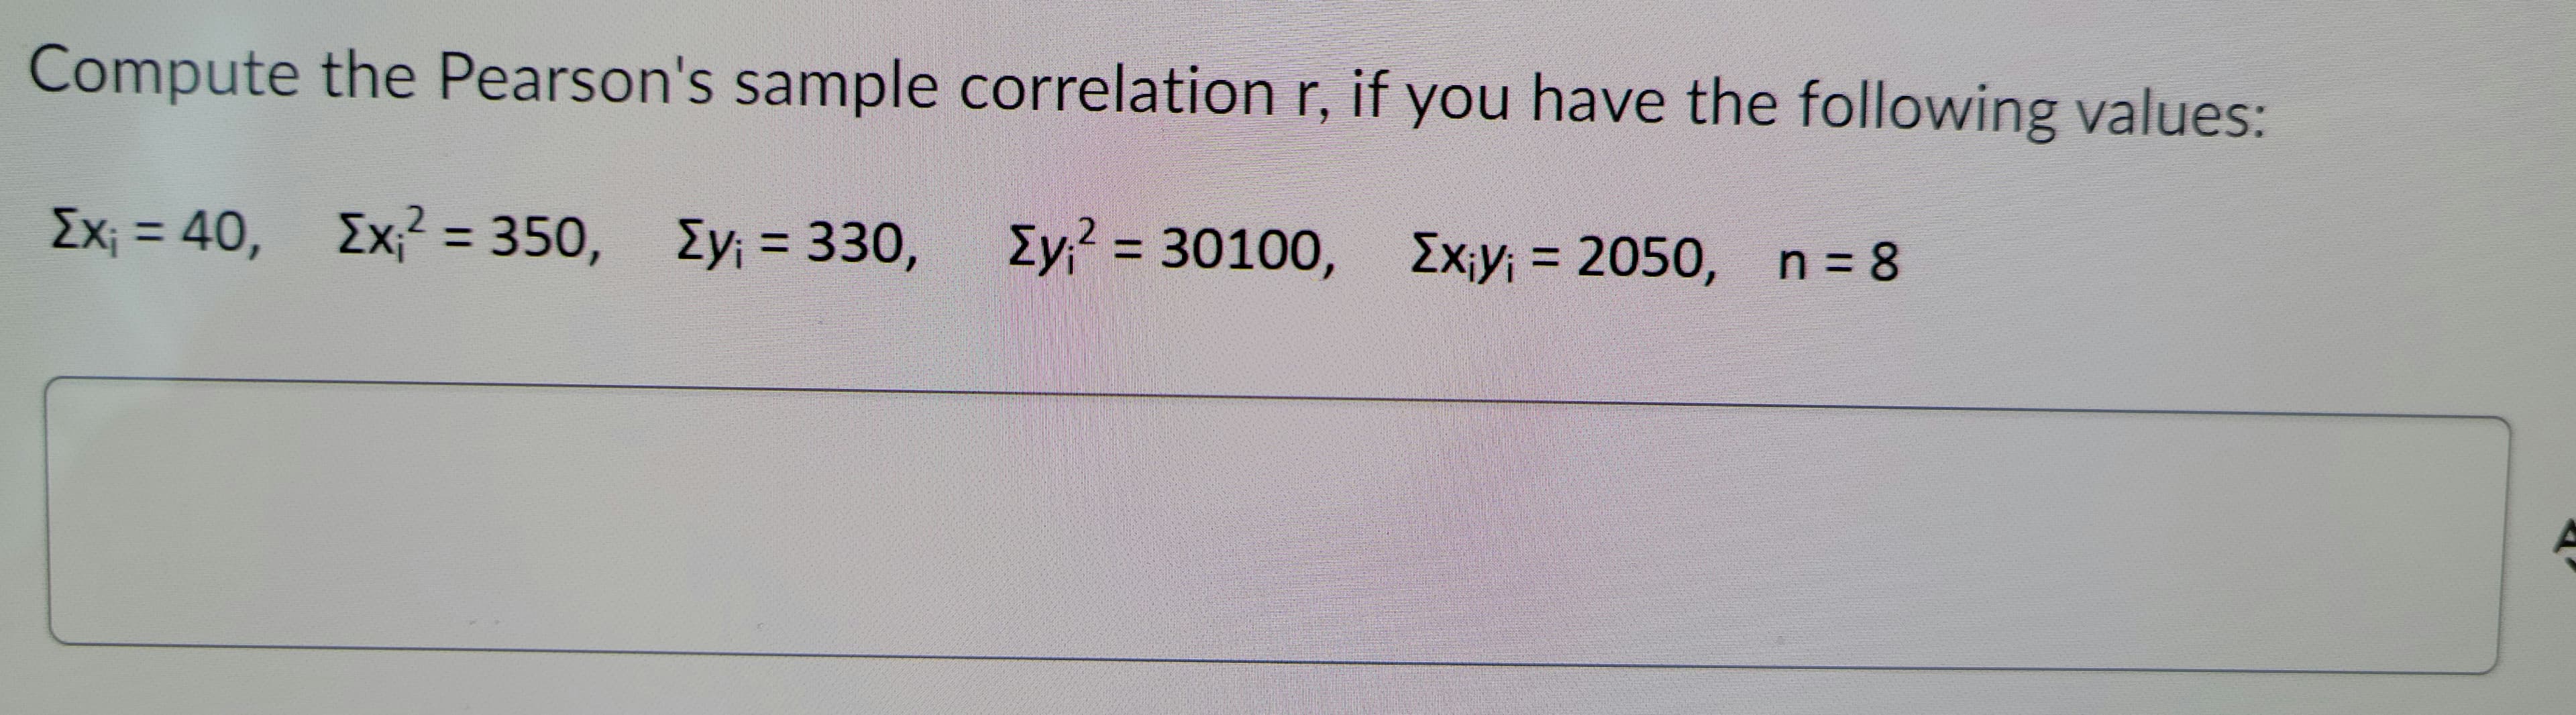
Transcribed Image Text:Compute the Pearson's sample correlation r, if you have the following values:
Σχ40, Σχ350, Σy = 330,
Ey; 330,
Σ
Ey = 30100, Ex;y; = 2050, n = 8
Σχ
%3D8
%3D
%3D
%3D
Expert Solution
This question has been solved!
Explore an expertly crafted, step-by-step solution for a thorough understanding of key concepts.

This is a popular solution!

Trending now
This is a popular solution!

Step by step
Solved in 2 steps with 2 images

Recommended textbooks for you
Glencoe Algebra 1, Student Edition, 9780079039897…
Algebra
ISBN:
9780079039897
Author:
Carter
Publisher:
McGraw Hill
Glencoe Algebra 1, Student Edition, 9780079039897…
Algebra
ISBN:
9780079039897
Author:
Carter
Publisher:
McGraw Hill