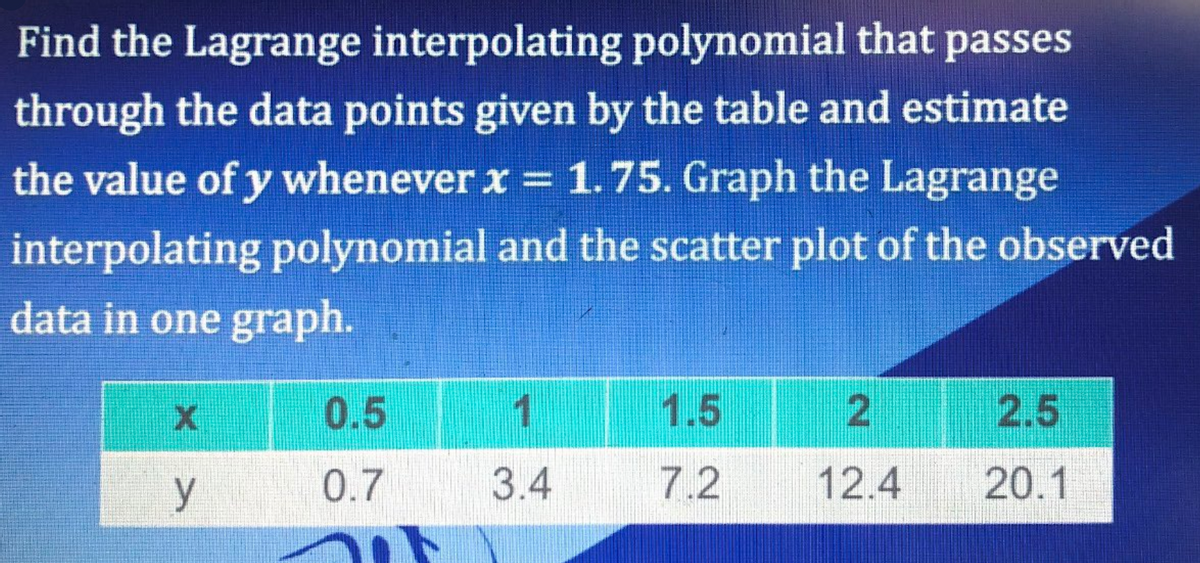
Find the Lagrange interpolating polynomial that passes through the data points given by the table and estimate the value of y whenever x = 1.75. Graph the Lagrange interpolating polynomial and the scatter plot of the observed data in one graph. 1 1.5 2 2.5 y 3.4 7.2 20.1 0.5 0.7 12.4
Q: * 13. Mr. Sy asserts that fewer than 5% of the bulbs that he sells are defective. Suppose 300 bulbs…
A:
Q: Correlation Matrix edlevel salnow age time work salbeg edlevel Pearson's r —…
A: Given information: Correlation Matrix edlevel salnow age edlevel Pearson's r —…
Q: Here is a sample data set. 207.7 258 262.7 274.7 229 255.7 277.6 290.5 342.4 395.2 406.5 426.2 455.7…
A:
Q: How many ways can you select a committee of 4 student our of 10 students?
A: As per our guidelines we are suppose to answer only one question4)Given Total no.of…
Q: At a 0.05, test to see if the population variances from which the following samples were drawn are…
A:
Q: A toothpaste industry conducted a survey on consumer preference in Laguna. The survey showed that…
A:
Q: DO
A:
Q: What is the critical value, t, for a 95% confidence interval with a sample size of 18? 02.101 O…
A: Given that Sample size n =18 95% confidence interval
Q: Testing: Ho:μ = 9.915 H₁:µ‡ 9.915 Your sample consists of 27 subjects, with a mean of 9.8 and a…
A:
Q: The mean of a sampling distribution of means of a population is equal to: a.Population mean b. None…
A: As per Bartley guideline expert have to answer first question only since I had done all for you....
Q: The local coffee shop keeps track of how much coffee they sell versus the temperature on that day,…
A: In this case, the independent variable is the temperature (x) and the dependent variable is the…
Q: Let x be a random variable that represents the percentage of successful free throws a professional…
A: Use EXCEL to determine the regression equation.. EXCEL procedure: Go to EXCEL Go to…
Q: Problem 7 - (part 1) What is the sum of the mean, median, and mode of these data? 4, 5, 6, 10, 10…
A: Give problem Given that Given data 4, 5, 6, 10, 10 Mean : The formula is, = ( 4 + 5 + 6 + 10 +…
Q: sed on a two-tailed t-test,what will be the conclusion of the significance test for this correlation…
A: From there results of first question, the correlation value is 0.97.
Q: The results of a calculus exam are normally distributed with a mean of 76 and a standard deviation…
A: GivenMean(μ)=76standard deviation(σ)=6
Q: Data was collected for a sample of organic snacks. The amount of sugar (in mg) in each snack is…
A: Given that Sample size n = sum of frequency from given histogram.
Q: Identifying Type I and Type II Errors A new electronic component for aircraft is tested to withstand…
A: Type l error : Rejecting H0 when it is true. Type l error is denoted by α Type ll error :…
Q: Given a J.p.f of x and y as (x + y for 0<x<1,0 <y<1 f(x, y) = {* t " O.W then the marginal.p.f of x…
A:
Q: A set of exam scores is normally distributed with a mean = 82 and standard deviation = 6. Use the…
A:
Q: Listed below are the amounts of net worth (in millions of dollars) of the ten wealthiest celebrities…
A:
Q: Let X₁, X2,..., X, be independent random variables, each of which obeys Poisson's law am P(X, m) e-a…
A:
Q: The critical region and critical value for a hypothesis test are shown below. The test statistic is…
A: Solution Given test statistic = Z = 1.34 Critical value from rejection region = Za= 1.41
Q: digits 1, 4, 5, and 9, construct the sampling distribution of the sample mean a) With a sample size…
A:
Q: tutu In physiology, an objective measure of aerobic fitness is how efficiently the body can absorb…
A: Given information: Shapiro Wilk Normality test data: restpulse_male W = 0.94898, p-value =…
Q: In a factory manufacturing electronic components there are four machine operators and five machines…
A: State the hypotheses Let Factor A denotes the types of Operators. Let Factor B denotes the types…
Q: QUESTION 21 Explain in detail four types of probability sampling techniques.
A: Probability sampling techniques can be classified into four types.
Q: 1. Suppose that the dependent variable y is directly related to the independent variable x by the…
A:
Q: A random process is defined by X()=Kcoswt 120 wi onstant and K is uniformly distributed between 0…
A: *Answer:
Q: The marketing manager of a large multinational corporation is concerned that some salespersons…
A:
Q: 1. A random sample of n observations is selected from a normal population. Specify the rejection…
A:
Q: Let X₁, X₂, ..., X, be an independent identical random sample from a population with a Rayleigh…
A:
Q: 6. Given a normal distribution with a mean of 400 and a standard deviation of 60, find the…
A:
Q: 2 A discrete random variable Y takes the values -1, 0 and 1 with probabilities 10, 1-0 and 10…
A:
Q: Manufacturer 1 2 3 19 29 21 26 26 19 24 32 24 27 25 16 (a) Use these data to test whether the p
A: a) By applying the ANOVA test for a single factor, The Null and alternative hypothesis: Ho: µ1 =…
Q: Given a marginal p.m.f of x: f₁(x) (x) = { // , for x = 5,6 0 O.W and a marginal p.m.f of y: f2(y) =…
A: Note: According to Bartleby guidelines expert solve only one question and rest can be reposted. Fid…
Q: A manufacturer of shampoo claims that 42% of the shampoo users prefer brand X. To test this claim, a…
A: Solution-: Given: n=59,x=20,P0=0.42,α=0.1 Claim: A manufacturer of shampoo claims that 42% of the…
Q: The records of a casualty Insurance company show that, in the past, its clients have had a mean of…
A:
Q: (Round to three decimal places as needed.) b) Identify the value of the margin of error E. E= (Round…
A: Given that Sample size n =4667 Favorable cases x =184 Sample proportion p^=x/n =184/4667 =0.039
Q: TUS 52 Exercise: Suppose X₁ and X2 are independent N(u, 1) random variables, for an unknown…
A:
Q: Every employee of Space Electronix took a weight test. The average weight of 240 employees are 70 kg…
A:
Q: We are interested in determining whether or not the variances of the sales at two small grocery…
A: Given that Store A Store B Sample size (n1)= 10 Sample size (n2) = 12 Sample Standard…
Q: A survey found that women's heights are normally distributed with mean 63.1 in. and standard…
A:
Q: work
A: The Equation: p = 0.89t + 4.92 Equating this to Y = mx + b ie. equation of straight line
Q: 2. Use the following data obtained from ages of the last six U. S. Presidents at the time of their…
A:
Q: .5 (a) For a certain type of manufactured product, the weight is expected to be 350 gm, and the…
A: Introduction :- Here we want to do hypothesis testing for single mean.
Q: In an experiment to test whether final digits of telephone numbers are random, a random sample of 40…
A: Solution:
Q: Test the claim that the proportion of men who own cats is smaller than the proportion of women who…
A: Given Significance level=0.01 n1=60 n2=20
Q: What do you think would help students pay more attention in class?
A: Here we want to know bias in survey question or not.
Q: accept the null Correct As such, the final conclusion is that... There is not sufficient sample…
A:
Q: Provide an example of a study, including the variables, level of measurement, and hypotheses, for…
A: Inferential statistics is about testing a claim about a population using suitable test statistic.
Trending now
This is a popular solution!
Step by step
Solved in 3 steps with 3 images
- Determine the best (according to sum-of-squares-measure) curve y =Axb through the dataabove.Transformed equation ln(y) = ln(A) + b ln(x)orY = a + bX.he variable which has an insignificant effect on the duration of the stop is _____ Coefficients Standard Error t Stat P-value Lower 95% Upper 95% Intercept 6.623708 0.413166 16.03161 1.1E-57 5.813897 7.433519 age -0.01104 0.001583 -6.97062 3.2E-12 -0.01414 -0.00793 height -0.00826 0.006816 -1.2123 0.225405 -0.02162 0.005096 weight 0.00246 0.00074 3.325253 0.000884 0.00101 0.003911 arstmade 1.844518 0.077264 23.87308 3.3E-125 1.69308 1.995956 Black -0.47463 0.037618 -12.617 1.95E-36 -0.54836 -0.4009 sex -0.74561 0.074776 -9.97129 2.15E-23 -0.89218 -0.59905 Group of answer choices height age Weight Black Sex PreviousNextA correlation of r = .85 is found between weekly sales of firewood and coughdrops over a 1-year period. Which of the following is true? (a) There is a pretty strong positive linear relationship between sales of firewood and cough drops. (b) Fire must be the cause of coughing. (c) Temperature is a possible lurking variable that is “behind” this relationship. (d) Both (a) and (c) are true. (e) None of the above.
- 6. Select the scatter plot that goes with the data shown below. Then, determine whether a linear, quadratic, or exponential model is the most appropriate for the data. Hour Temperature 1 35 2 45 3 50 4 55 5 47 6 40 7 34 linear quadratic exponentialA scientist is interested in whether there is a linear relationship between the amount of mercury in a lake and the surface area of the lake. The scientist collected data on 22 lakes of a similar type selected at random and used the data to test the claim that there is a linear relationship. The following hypotheses were used to test the claim. H0:β=0 Ha:β≠0 The test yielded a t-value of 2.086 with a corresponding p-value of 0.05. Which of the following is the correct interpretation of the p-value? A. If there is a linear relationship between the amount of mercury in a lake and the surface area of the lake, the probability of observing a test statistic as extreme as 2.086 or more extreme is 0.05 B. If there is a linear relationship between the amount of mercury in a lake and the surface area of the lake, the probability of observing a test statistic of 2.086 is 0.05. C. If there is not a linear relationship between the amount of mercury in a lake and the surface area of the lake, the…A Filipino analyst used regression analysis between $ sales (y) and $ advertising (x) across all the branches of a major international corporation. He obtained the following regression function. y = 6000 + 7.5x If the advertising budgets of one the of branches of the corporation is $12,250, then what will be the predicted sales? A. $97,875 B. $91,875 C. $18,257.50 D. $6000
- A researcher believes that there is a linear association between the level of potassiumcontent (y) in milligrams and the amount of fiber (x) in grams in cereal. The regression line forthe data is computed to be: ŷ = 36+27x rate. It was also computed that r = .62 a. If a cereal has 4 grams of fiber, what is its predicted potassium content?The regression line for a data set showing the monthly utility bill U in a certain city versus the square footage F of the residence is given by U = 0.2F − 100 dollars. What monthly utility bill would be expected for a 2500 square foot home in this city? $Please show formulas thank tou and on TI-84 calculator A test of H0:ρ=0H0:ρ=0 versus Ha:ρ≠0Ha:ρ≠0 determines that there is evidence of a linear relationship between the variables x and y at the 10% level. Which of the following is a possible p-value for this test? The p-value could be any of 0.06, 0.11, 0.82, or 1.15. 0.06 0.11 1.15 0.82 In a sample of 390 people attending a concert, 60% stated that the venue was a good location for that type of concert. What p-value is calculated when testing Ho:p≤0.65Ho:p≤0.65 versus p>0.65p>0.65 ? 0.0194 0.0219 0.9808 0.6000 0.0192 A hypothesis test to test the claim about a population mean in which the alternative hypothesis is Ha:μ≠225Ha:μ≠225 is conducted. A random sample was collected with the results of ¯x=200x¯=200 and s=54.2s=54.2 for a sample of size 14. What are the critical values for this test if the significance level is 5%? ±2.145 ±1.726 ±2.160 ±1771 ±1.96
- The following table shows the length, in meters, of the winning long jump in the Olympic Games for the indicated year. (One meter is 39.37 inches.) Year 1900 1904 1908 1912 Length 7.19 7.34 7.48 7.60 (a) Find the equation of the regression line that gives the length as a function of time. (Let t be the number of years since 1900 and L the length of the wining long jump, in meters. Round the regression line parameters to three decimal places.) L(t) = 0.034t+7.197 (b) Explain in practical terms the meaning of the slope of the regression line. In practical terms the meaning of the slope, meter per year, of the regression line is that each year the length of the winning long jump increased by an average of meter, or about inches.The following table lists a country's college and university enrollments in thousands to study a particular language. Year 1980 1986 1995 2002 2009 Enrollment 20 26 36 43 70 (a) Use regression to find a quadratic function that models the data. Choose the correct answer below. Then graph the regression line and given data points.a) f(x)=0.055562x2 - 220.05x + 217,895b) f(x)=0.086562x2 + 220.05x + 217,895c) f(x)=0.086562x2 - 220.05x + 217,895d) f(x)=0.055562x2 + 220.05x + 217,895 (b) Estimate the enrollment in 2007 and compare it to the actual value of 63 thousand. (Use part A to find the answer. Round to the nearest integer as needed)a) The estimated enrollment in 2007 is ____ thousand, which is ____ thousand higher than the actual value.b) The estimated enrollment in 2007 is the same as the actual value.c) The estimated enrollment in 2007 is ____ thousand, which is ___ thousand lower than the actual value.Suppose that f is a linear function such that f(3) = 6. If the slope of f is 2.9, then what is f(4)? (Round your answer to one decimal place.) f(4) =