Step 1 Exercise 29 gives a probability model for the grade of a randomly chosen student in Statistics 101 at North Carolina State University, using the 4-point scale. From Exercise 29: North Carolina State University posts the grade distributions for its courses online. Students in Statistics 101 in a recent semester earned 21% A's, 43% B's, 30% C's, 5% D's, and 1% F's. Here is the probability model for the grade of a randomly chosen Statistics 101 student. 0 (F) 1 (D) 2 (C) 3 (B) 4 (A) Grade Probability 0.01 0.05 0.30 0.43 0.21 What is the mean grade in this course? (Fill in the blank below and give your answer to 2 decimal places.) The mean is u =
Step 1 Exercise 29 gives a probability model for the grade of a randomly chosen student in Statistics 101 at North Carolina State University, using the 4-point scale. From Exercise 29: North Carolina State University posts the grade distributions for its courses online. Students in Statistics 101 in a recent semester earned 21% A's, 43% B's, 30% C's, 5% D's, and 1% F's. Here is the probability model for the grade of a randomly chosen Statistics 101 student. 0 (F) 1 (D) 2 (C) 3 (B) 4 (A) Grade Probability 0.01 0.05 0.30 0.43 0.21 What is the mean grade in this course? (Fill in the blank below and give your answer to 2 decimal places.) The mean is u =

Chapter8: Sequences, Series,and Probability
Section8.7: Probability
Problem 11ECP: A manufacturer has determined that a machine averages one faulty unit for every 500 it produces....

Related questions
Question
Transcribed Image Text:Step 1
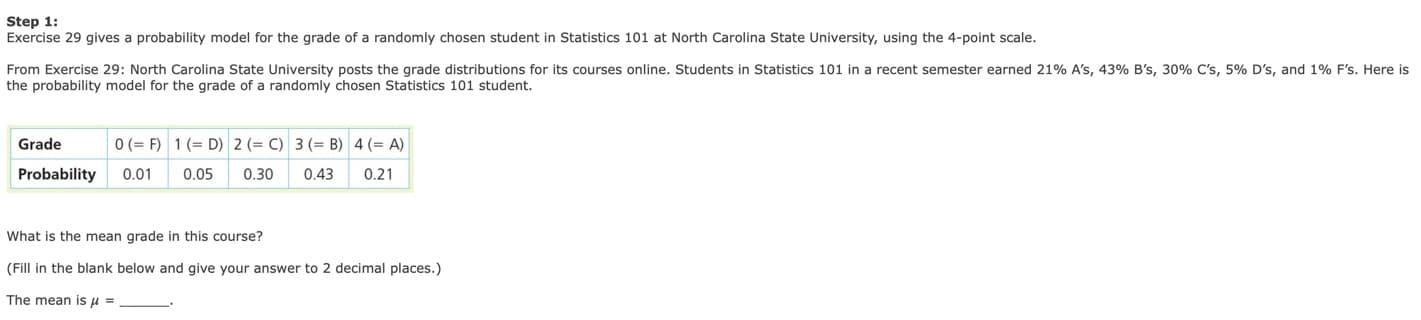
Exercise 29 gives a probability model for the grade of a randomly chosen student in Statistics 101 at North Carolina State University, using the 4-point scale.
From Exercise 29: North Carolina State University posts the grade distributions for its courses online. Students in Statistics 101 in a recent semester earned 21% A's, 43% B's, 30% C's, 5% D's, and 1% F's. Here is
the probability model for the grade of a randomly chosen Statistics 101 student.
0 (F)
1 (D) 2 (C) 3 (B) 4 (A)
Grade
Probability
0.01
0.05
0.30
0.43
0.21
What is the mean grade in this course?
(Fill in the blank below and give your answer to 2 decimal places.)
The mean is u =
Expert Solution
This question has been solved!
Explore an expertly crafted, step-by-step solution for a thorough understanding of key concepts.

This is a popular solution!

Trending now
This is a popular solution!

Step by step
Solved in 2 steps with 2 images

Recommended textbooks for you