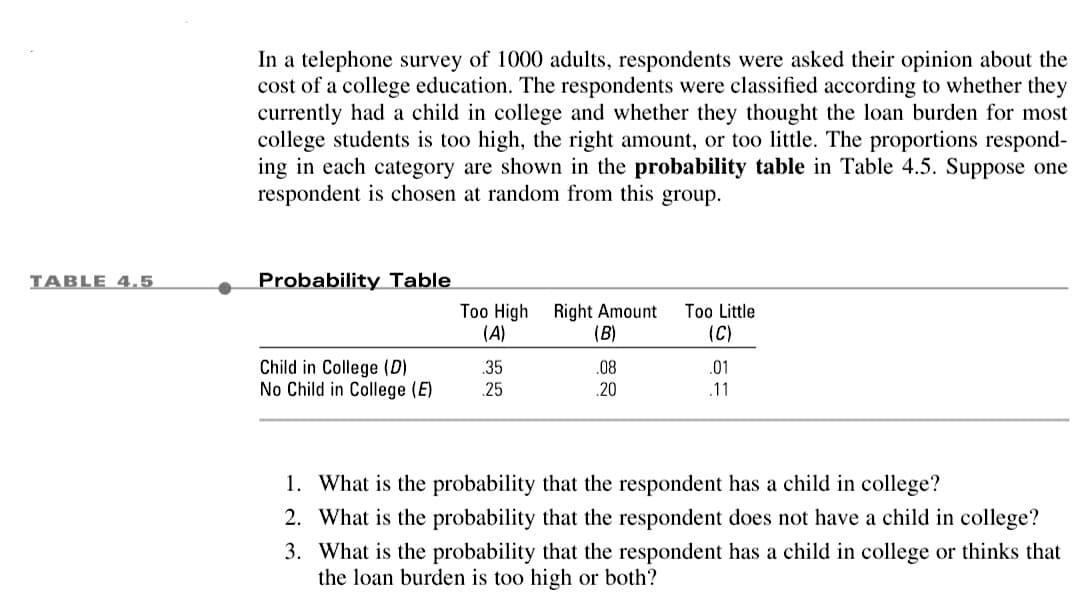
TABLE 4.5 In a telephone survey of 1000 adults, respondents were asked their opinion about the cost of a college education. The respondents were classified according to whether they currently had a child in college and whether they thought the loan burden for most college students is too high, the right amount, or too little. The proportions respond- ing in each category are shown in the probability table in Table 4.5. Suppose one respondent is chosen at random from this group. Probability Table Too High Right Amount (A) Too Little (C) (B) Child in College (D) .35 .08 .01 No Child in College (E) .25 20 11 1. What is the probability that the respondent has a child in college? 2. What is the probability that the respondent does not have a child in college? 3. What is the probability that the respondent has a child in college or thinks that the loan burden is too high or both?
TABLE 4.5 In a telephone survey of 1000 adults, respondents were asked their opinion about the cost of a college education. The respondents were classified according to whether they currently had a child in college and whether they thought the loan burden for most college students is too high, the right amount, or too little. The proportions respond- ing in each category are shown in the probability table in Table 4.5. Suppose one respondent is chosen at random from this group. Probability Table Too High Right Amount (A) Too Little (C) (B) Child in College (D) .35 .08 .01 No Child in College (E) .25 20 11 1. What is the probability that the respondent has a child in college? 2. What is the probability that the respondent does not have a child in college? 3. What is the probability that the respondent has a child in college or thinks that the loan burden is too high or both?

Holt Mcdougal Larson Pre-algebra: Student Edition 2012
1st Edition
ISBN:9780547587776
Author:HOLT MCDOUGAL
Publisher:HOLT MCDOUGAL
Chapter11: Data Analysis And Probability
Section11.8: Probabilities Of Disjoint And Overlapping Events
Problem 2C

Related questions
Question
Transcribed Image Text:TABLE 4.5
In a telephone survey of 1000 adults, respondents were asked their opinion about the
cost of a college education. The respondents were classified according to whether they
currently had a child in college and whether they thought the loan burden for most
college students is too high, the right amount, or too little. The proportions respond-
ing in each category are shown in the probability table in Table 4.5. Suppose one
respondent is chosen at random from this group.
Probability Table
Too High
Right Amount
Too Little
(C)
(A)
(B)
Child in College (D)
.35
.08
.01
No Child in College (E)
.25
.20
.11
1. What is the probability that the respondent has a child in college?
2. What is the probability that the respondent does not have a child in college?
3. What is the probability that the respondent has a child in college or thinks that
the loan burden is too high or both?
Expert Solution
This question has been solved!
Explore an expertly crafted, step-by-step solution for a thorough understanding of key concepts.

This is a popular solution!

Trending now
This is a popular solution!

Step by step
Solved in 4 steps with 4 images

Recommended textbooks for you
Holt Mcdougal Larson Pre-algebra: Student Edition…
Algebra
ISBN:
9780547587776
Author:
HOLT MCDOUGAL
Publisher:
HOLT MCDOUGAL

Holt Mcdougal Larson Pre-algebra: Student Edition…
Algebra
ISBN:
9780547587776
Author:
HOLT MCDOUGAL
Publisher:
HOLT MCDOUGAL