Student Chris Mary Paul Juan Marcelo Table #1 1. SP 2.2 3. ΣΧ 4. 5. SSX 6. ΣΥ 7. SSY a 8. b Number of pages typed 37 46 18 26 16 Typing speed 62 56 25 50 55
Student Chris Mary Paul Juan Marcelo Table #1 1. SP 2.2 3. ΣΧ 4. 5. SSX 6. ΣΥ 7. SSY a 8. b Number of pages typed 37 46 18 26 16 Typing speed 62 56 25 50 55

Glencoe Algebra 1, Student Edition, 9780079039897, 0079039898, 2018
18th Edition
ISBN:9780079039897
Author:Carter
Publisher:Carter
Chapter10: Statistics
Section10.5: Comparing Sets Of Data
Problem 26PFA

Related questions
Question
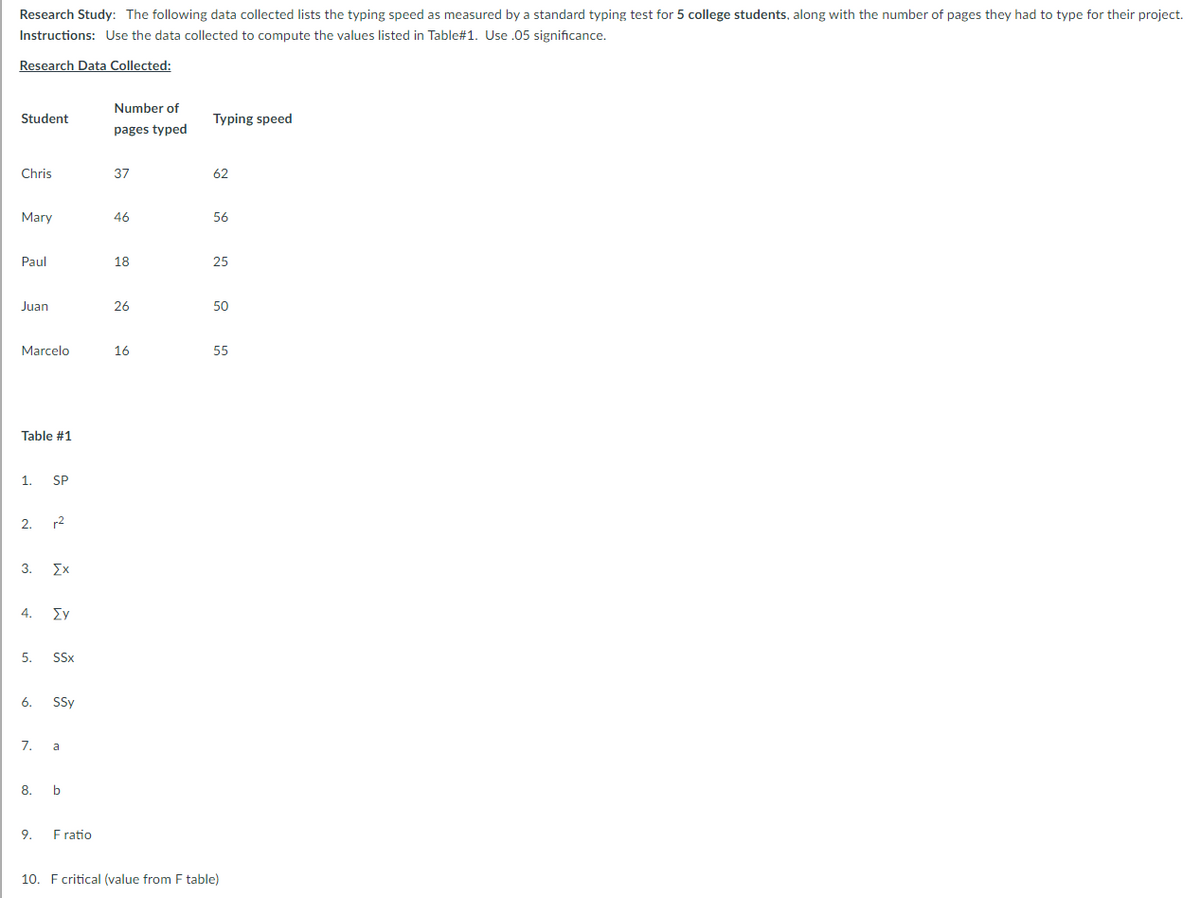
Transcribed Image Text:Research Study: The following data collected lists the typing speed as measured by a standard typing test for 5 college students, along with the number of pages they had to type for their project.
Instructions: Use the data collected to compute the values listed in Table#1. Use .05 significance.
Research Data Collected:
Student
Chris
Mary
Paul
Juan
Marcelo
Table #1
1. SP
9
2. r2
3.
ΣΧ
4. ΣΥ
5. SSX
6. SSY
7. a
9.
8. b
F ratio
Number of
pages typed
37
46
18
26
16
Typing speed
62
56
25
50
55
10. F critical (value from F table)
Expert Solution
This question has been solved!
Explore an expertly crafted, step-by-step solution for a thorough understanding of key concepts.

Step by step
Solved in 3 steps with 3 images

Recommended textbooks for you
Glencoe Algebra 1, Student Edition, 9780079039897…
Algebra
ISBN:
9780079039897
Author:
Carter
Publisher:
McGraw Hill

Holt Mcdougal Larson Pre-algebra: Student Edition…
Algebra
ISBN:
9780547587776
Author:
HOLT MCDOUGAL
Publisher:
HOLT MCDOUGAL
Glencoe Algebra 1, Student Edition, 9780079039897…
Algebra
ISBN:
9780079039897
Author:
Carter
Publisher:
McGraw Hill
Holt Mcdougal Larson Pre-algebra: Student Edition…
Algebra
ISBN:
9780547587776
Author:
HOLT MCDOUGAL
Publisher:
HOLT MCDOUGAL