Students A and B used the following steps to find the heat capacity of a sample of duralumin alloy: 1. Filled a polystyrene cup with approx. 125 g of water at temp 55°C 2. Observed the temperature of the hot water at 1 minute intervals for 8 minutes 3. Took duralumin metal sample from constant temperature vessel at approx. 20°C and submerged it in the hot water 4. Observed the temperature of the water plus duralumin at 1 minute intervals for 8 more minutes See the image below for the results. 1. in what ways was heat energy transferred in this experiment? Is it the hot water transfer heat to the alloy


Energy transfer
The flow of energy from one region to another region is referred to as energy transfer. Since energy is quantitative; it must be transferred to a body or a material to work or to heat the system.
Molar Specific Heat
Heat capacity is the amount of heat energy absorbed or released by a chemical substance per the change in temperature of that substance. The change in heat is also called enthalpy. The SI unit of heat capacity is Joules per Kelvin, which is (J K-1)
Thermal Properties of Matter
Thermal energy is described as one of the form of heat energy which flows from one body of higher temperature to the other with the lower temperature when these two bodies are placed in contact to each other. Heat is described as the form of energy which is transferred between the two systems or in between the systems and their surrounding by the virtue of difference in temperature. Calorimetry is that branch of science which helps in measuring the changes which are taking place in the heat energy of a given body.
Students A and B used the following steps to find the heat capacity of a sample of duralumin
alloy:
1. Filled a polystyrene cup with approx. 125 g of water at temp 55°C
2. Observed the temperature of the hot water at 1 minute intervals for 8 minutes
3. Took duralumin metal sample from constant temperature vessel at approx. 20°C and submerged
it in the hot water
4. Observed the temperature of the water plus duralumin at 1 minute intervals for 8 more minutes
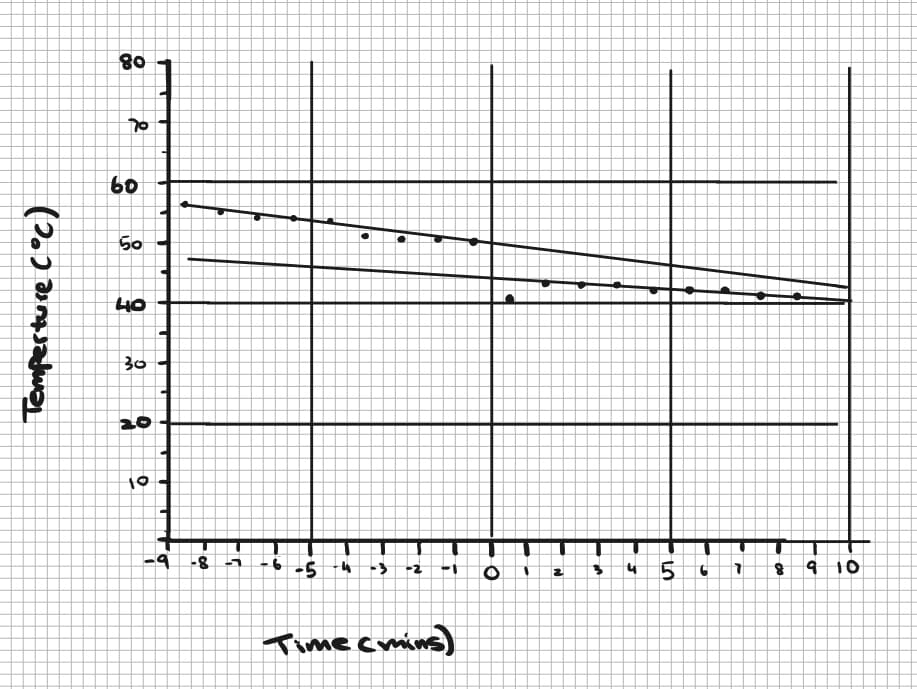
See the image below for the results.
1. in what ways was heat energy transferred in this experiment? Is it the hot water transfer heat to the alloy sample and the environment of something else?
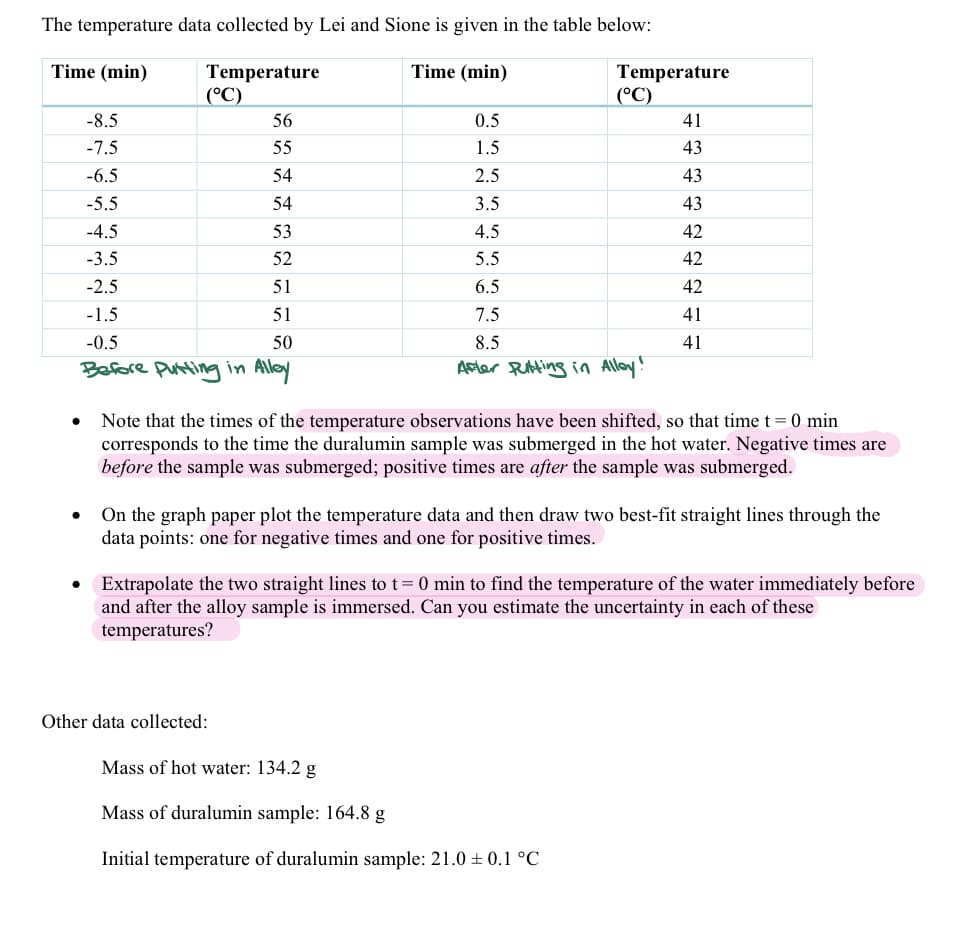
2. Should the data point at t=+0.5 minutes be included in the line of best fit for positive time?
3. What were the temperature changes of the water and the alloy sample, estimate the uncertainties?
4. Find the specfic heat capacity of the duralumin alloy sample. Estimate the uncertainty in this value? Q=mcT
water specific heat = 4190 J kg-1K-1


Trending now
This is a popular solution!

Step by step
Solved in 3 steps


