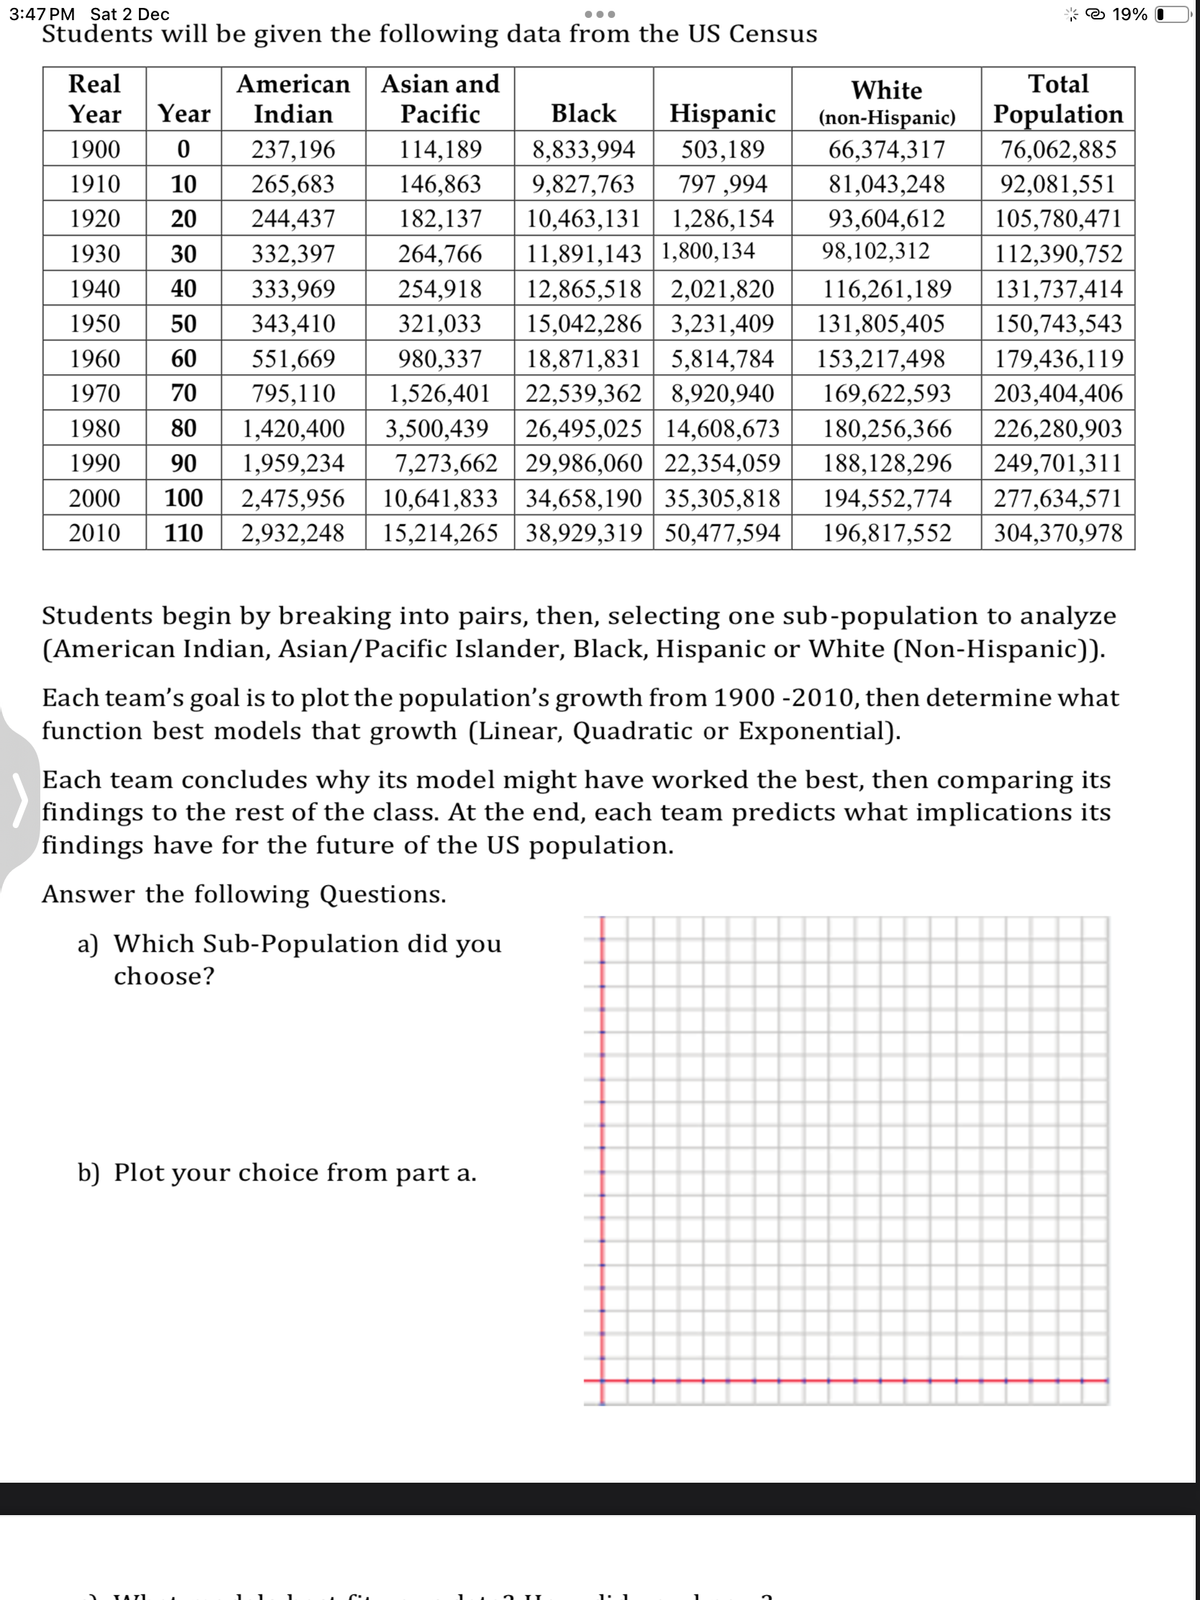
Students will be given the following data from the US Census Real American Asian and Year Year Indian Total Population Pacific 1900 0 237,196 114,189 8,833,994 76,062,885 1910 10 265,683 146,863 9,827,763 92,081,551 1920 20 244,437 182,137 10,463,131 1,286,154 105,780,471 1930 30 332,397 264,766 11,891,143 1,800,134 112,390,752 1940 40 333,969 254,918 12,865,518 2,021,820 116,261,189 131,737,414 1950 50 343,410 321,033 15,042,286 3,231,409 131,805,405 150,743,543 1960 60 551,669 980,337 153,217,498 179,436,119 1970 70 169,622,593 203,404,406 26,495,025 14,608,673 180,256,366 226,280,903 795,110 1,526,401 1980 80 1,420,400 3,500,439 1990 90 1,959,234 7,273,662 29,986,060 22,354,059 2000 100 2,475,956 10,641,833 34,658,190 35,305,818 2010 110 2,932,248 15,214,265 38,929,319 50,477,594 196,817,552 304,370,978 188,128,296 249,701,311 194,552,774 277,634,571 White Black Hispanic (non-Hispanic) 503,189 66,374,317 797,994 81,043,248 93,604,612 98,102,312 18,871,831 5,814,784 22,539,362 8,920,940 Students begin by breaking into pairs, then, selecting one sub-population to analyze (American Indian, Asian/Pacific Islander, Black, Hispanic or White (Non-Hispanic)). Each team's goal is to plot the population's growth from 1900-2010, then determine what function best models that growth (Linear, Quadratic or Exponential). b) Plot your choice from part a. Each team concludes why its model might have worked the best, then comparing its findings to the rest of the class. At the end, each team predicts what implications its findings have for the future of the US population. Answer the following Questions. a) Which Sub-Population did you choose?
Students will be given the following data from the US Census Real American Asian and Year Year Indian Total Population Pacific 1900 0 237,196 114,189 8,833,994 76,062,885 1910 10 265,683 146,863 9,827,763 92,081,551 1920 20 244,437 182,137 10,463,131 1,286,154 105,780,471 1930 30 332,397 264,766 11,891,143 1,800,134 112,390,752 1940 40 333,969 254,918 12,865,518 2,021,820 116,261,189 131,737,414 1950 50 343,410 321,033 15,042,286 3,231,409 131,805,405 150,743,543 1960 60 551,669 980,337 153,217,498 179,436,119 1970 70 169,622,593 203,404,406 26,495,025 14,608,673 180,256,366 226,280,903 795,110 1,526,401 1980 80 1,420,400 3,500,439 1990 90 1,959,234 7,273,662 29,986,060 22,354,059 2000 100 2,475,956 10,641,833 34,658,190 35,305,818 2010 110 2,932,248 15,214,265 38,929,319 50,477,594 196,817,552 304,370,978 188,128,296 249,701,311 194,552,774 277,634,571 White Black Hispanic (non-Hispanic) 503,189 66,374,317 797,994 81,043,248 93,604,612 98,102,312 18,871,831 5,814,784 22,539,362 8,920,940 Students begin by breaking into pairs, then, selecting one sub-population to analyze (American Indian, Asian/Pacific Islander, Black, Hispanic or White (Non-Hispanic)). Each team's goal is to plot the population's growth from 1900-2010, then determine what function best models that growth (Linear, Quadratic or Exponential). b) Plot your choice from part a. Each team concludes why its model might have worked the best, then comparing its findings to the rest of the class. At the end, each team predicts what implications its findings have for the future of the US population. Answer the following Questions. a) Which Sub-Population did you choose?

Functions and Change: A Modeling Approach to College Algebra (MindTap Course List)
6th Edition
ISBN:9781337111348
Author:Bruce Crauder, Benny Evans, Alan Noell
Publisher:Bruce Crauder, Benny Evans, Alan Noell
Chapter5: A Survey Of Other Common Functions
Section5.3: Modeling Data With Power Functions
Problem 6E: Urban Travel Times Population of cities and driving times are related, as shown in the accompanying...

Related questions
Question
Transcribed Image Text:3:47 PM Sat 2 Dec
...
Students will be given the following data from the US Census
Real
Asian and
White
Year Year
Total
Population
Pacific
Black Hispanic (non-Hispanic)
1900
0
237,196
8,833,994 503,189
66,374,317
76,062,885
114,189
146,863 9,827,763 797,994
1910 10
265,683
81,043,248
92,081,551
1920
20 244,437
182,137
10,463,131 1,286,154
93,604,612
105,780,471
1930 30
264,766
11,891,143 1,800,134
98,102,312
112,390,752
254,918
12,865,518 2,021,820
116,261,189
131,737,414
321,033
15,042,286 3,231,409 131,805,405
150,743,543
980,337
18,871,831 5,814,784
153,217,498
179,436,119
332,397
1940 40 333,969
1950 50 343,410
1960 60 551,669
1970 70 795,110
22,539,362 8,920,940 169,622,593
1980 80 1,420,400
26,495,025 14,608,673 180,256,366
1990 90 1,959,234
29,986,060 22,354,059 188,128,296 249,701,311
2000 100 2,475,956 10,641,833 34,658,190 35,305,818 194,552,774
2010 110 2,932,248 15,214,265 38,929,319 50,477,594 196,817,552
203,404,406
1,526,401
3,500,439
7,273,662
226,280,903
277,634,571
304,370,978
American
Indian
Students begin by breaking into pairs, then, selecting one sub-population to analyze
(American Indian, Asian/Pacific Islander, Black, Hispanic or White (Non-Hispanic)).
19%
Each team's goal is to plot the population's growth from 1900 -2010, then determine what
function best models that growth (Linear, Quadratic or Exponential).
Each team concludes why its model might have worked the best, then comparing its
findings to the rest of the class. At the end, each team predicts what implications its
findings have for the future of the US population.
Answer the following Questions.
a) Which Sub-Population did you
choose?
b) Plot your choice from part a.
TAXI
Transcribed Image Text:3:51 PM Sat 2 Dec
<
Blank 11
c) What models best fit your
=
●●●●
+
data? How did you know?
d) Use a graphing utility to find the equation of the regression. Round your
parameters to the nearest thousandth.
e) Using the equation, predict how big the population will be in 2025. Round
your answers to the nearest whole number and show your work.
f) Choose on your own a year in the future and predict how big the population
will be in that year. Round your answers to the nearest whole number and
show your work.
g) According to your equation or graph, in what year would (or did) the
population reach 60,000,000?
18% 0
MO
Expert Solution
This question has been solved!
Explore an expertly crafted, step-by-step solution for a thorough understanding of key concepts.

Step by step
Solved in 5 steps with 15 images

Recommended textbooks for you
Functions and Change: A Modeling Approach to Coll…
Algebra
ISBN:
9781337111348
Author:
Bruce Crauder, Benny Evans, Alan Noell
Publisher:
Cengage Learning

Glencoe Algebra 1, Student Edition, 9780079039897…
Algebra
ISBN:
9780079039897
Author:
Carter
Publisher:
McGraw Hill
Functions and Change: A Modeling Approach to Coll…
Algebra
ISBN:
9781337111348
Author:
Bruce Crauder, Benny Evans, Alan Noell
Publisher:
Cengage Learning
Glencoe Algebra 1, Student Edition, 9780079039897…
Algebra
ISBN:
9780079039897
Author:
Carter
Publisher:
McGraw Hill