Study Economics in the News in the eText or click on the icon Then answer the following questions. Price level (GDP deflator, 2012=100) 116- LAS SASNS 114- 2. The graph illustrates the economy in April 2020 with no stimulus. Draw a new aggregate demand curve and a new short-run aggregate supply curve that would have to occur to restore full employment. Label the curves. Draw a point at the new macroeconomic equilibrium. 112 110- 108 O O N 106+ 1200 ADNS 1500 1400 1600 1800 2000 2200 2400 Real GDP (billions of 2012 dollars) >>> Draw only the objects specified in the question.
Study Economics in the News in the eText or click on the icon Then answer the following questions. Price level (GDP deflator, 2012=100) 116- LAS SASNS 114- 2. The graph illustrates the economy in April 2020 with no stimulus. Draw a new aggregate demand curve and a new short-run aggregate supply curve that would have to occur to restore full employment. Label the curves. Draw a point at the new macroeconomic equilibrium. 112 110- 108 O O N 106+ 1200 ADNS 1500 1400 1600 1800 2000 2200 2400 Real GDP (billions of 2012 dollars) >>> Draw only the objects specified in the question.

Chapter8: Macroeconomic Equilibrium: Aggregate Demand And Supply
Section: Chapter Questions
Problem 12E

Related questions
Question
Please give me proper answer otherwise i give multiple downvote
Note:-
Please avoid using ChatGPT and refrain from providing handwritten solutions; otherwise, I will definitely give a downvote. Also, be mindful of plagiarism.
Answer completely and accurate answer.
Rest assured, you will receive an upvote if the answer is accurate.
Transcribed Image Text:Study Economics in the News in the eText or click on the icon Then
answer the following questions.
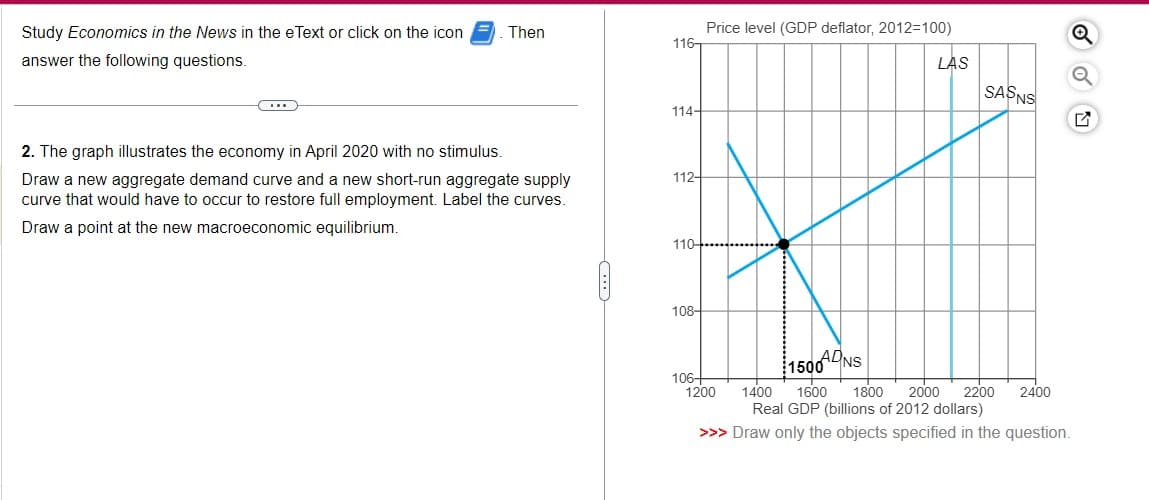
2. The graph illustrates the economy in April 2020 with no stimulus.
Price level (GDP deflator, 2012-100)
116-
LAS
SASNS
114-
Draw a new aggregate demand curve and a new short-run aggregate supply
curve that would have to occur to restore full employment. Label the curves.
Draw a point at the new macroeconomic equilibrium.
112
110-
108-
Q
106+
1200
1400
$1500
ADNS
1600
1800 2000 2200 2400
Real GDP (billions of 2012 dollars)
>>> Draw only the objects specified in the question.
Expert Solution
This question has been solved!
Explore an expertly crafted, step-by-step solution for a thorough understanding of key concepts.

Step by step
Solved in 3 steps with 2 images

Knowledge Booster


Learn more about
Need a deep-dive on the concept behind this application? Look no further. Learn more about this topic, economics and related others by exploring similar questions and additional content below.Recommended textbooks for you

Principles of Macroeconomics (MindTap Course List)
Economics
ISBN:
9781305971509
Author:
N. Gregory Mankiw
Publisher:
Cengage Learning

Principles of Economics, 7th Edition (MindTap Cou…
Economics
ISBN:
9781285165875
Author:
N. Gregory Mankiw
Publisher:
Cengage Learning
Principles of Macroeconomics (MindTap Course List)
Economics
ISBN:
9781305971509
Author:
N. Gregory Mankiw
Publisher:
Cengage Learning
Principles of Economics, 7th Edition (MindTap Cou…
Economics
ISBN:
9781285165875
Author:
N. Gregory Mankiw
Publisher:
Cengage Learning

Principles of Economics (MindTap Course List)
Economics
ISBN:
9781305585126
Author:
N. Gregory Mankiw
Publisher:
Cengage Learning

Brief Principles of Macroeconomics (MindTap Cours…
Economics
ISBN:
9781337091985
Author:
N. Gregory Mankiw
Publisher:
Cengage Learning

Principles of Macroeconomics (MindTap Course List)
Economics
ISBN:
9781285165912
Author:
N. Gregory Mankiw
Publisher:
Cengage Learning