Summarize what you see in the plots for each gender and compare the two graphs.

Algebra & Trigonometry with Analytic Geometry
13th Edition
ISBN:9781133382119
Author:Swokowski
Publisher:Swokowski
Chapter1: Fundamental Concepts Of Algebra
Section1.1: Real Numbers
Problem 51E

Related questions
Question
Summarize what you see in the plots for each gender and compare the two
graphs. (Is there a positive or negative relationship in the data? strong linear relationship or
weak?)
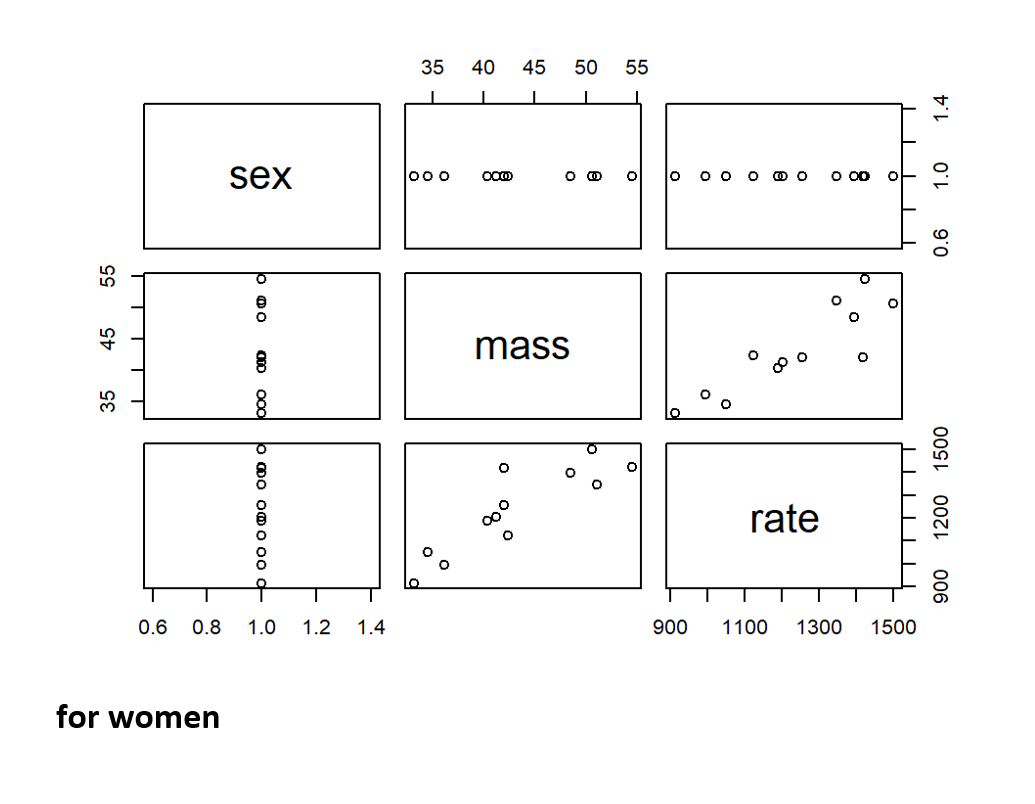
Transcribed Image Text:35
40
45
50
55
sex
o o o o O O
O 00
ooo
mass
rate
0.6
0.8
1.0
1.2
1.4
900
1100
1300
1500
for women
35
45
55
OD 0ool
o mo omo oo d- O
0.6
1.0
1.4
06
00SL 007L
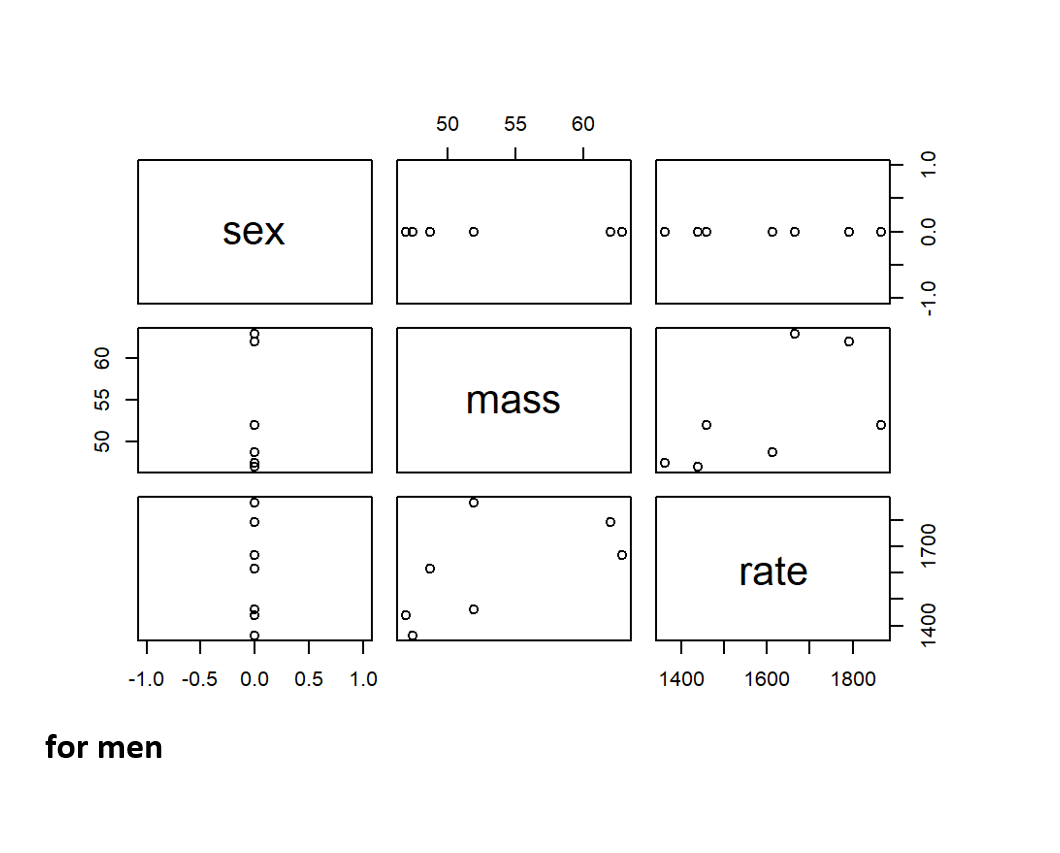
Transcribed Image Text:50
55
60
sex
o o
lo
O O
00
00
mass
of
rate
-1.0 -0.5 0.0
0.5
1.0
1400
1600
1800
for men
0'0
O'L-
o om
bo o0
Expert Solution
This question has been solved!
Explore an expertly crafted, step-by-step solution for a thorough understanding of key concepts.

Step by step
Solved in 3 steps

Recommended textbooks for you
Algebra & Trigonometry with Analytic Geometry
Algebra
ISBN:
9781133382119
Author:
Swokowski
Publisher:
Cengage


Algebra & Trigonometry with Analytic Geometry
Algebra
ISBN:
9781133382119
Author:
Swokowski
Publisher:
Cengage