Suppose a simple random sample of size n = 125 is obtained from a population whose size is N= 15,000 and whose population proportion with a specified characteristic is p =0.8. Click here to view the standard normal distribution table (page 1). Click here to view the standard normal distribution table (page 2). ..... (a) Describe the sampling distribution of p. Choose the phrase that best describes the shape of the sampling distribution below. A. Approximately normal because ns0.05N and np(1 - p) 2 10. B. Approximately normal because ns0.05N and np(1 – p)< 10. C. Not normal because n <0.05N and np(1 – p) 2 10. D. Not normal because ns0.05N and np(1 –p)< 10.
Suppose a simple random sample of size n = 125 is obtained from a population whose size is N= 15,000 and whose population proportion with a specified characteristic is p =0.8. Click here to view the standard normal distribution table (page 1). Click here to view the standard normal distribution table (page 2). ..... (a) Describe the sampling distribution of p. Choose the phrase that best describes the shape of the sampling distribution below. A. Approximately normal because ns0.05N and np(1 - p) 2 10. B. Approximately normal because ns0.05N and np(1 – p)< 10. C. Not normal because n <0.05N and np(1 – p) 2 10. D. Not normal because ns0.05N and np(1 –p)< 10.

Glencoe Algebra 1, Student Edition, 9780079039897, 0079039898, 2018
18th Edition
ISBN:9780079039897
Author:Carter
Publisher:Carter
Chapter10: Statistics
Section10.4: Distributions Of Data
Problem 19PFA

Related questions
Question
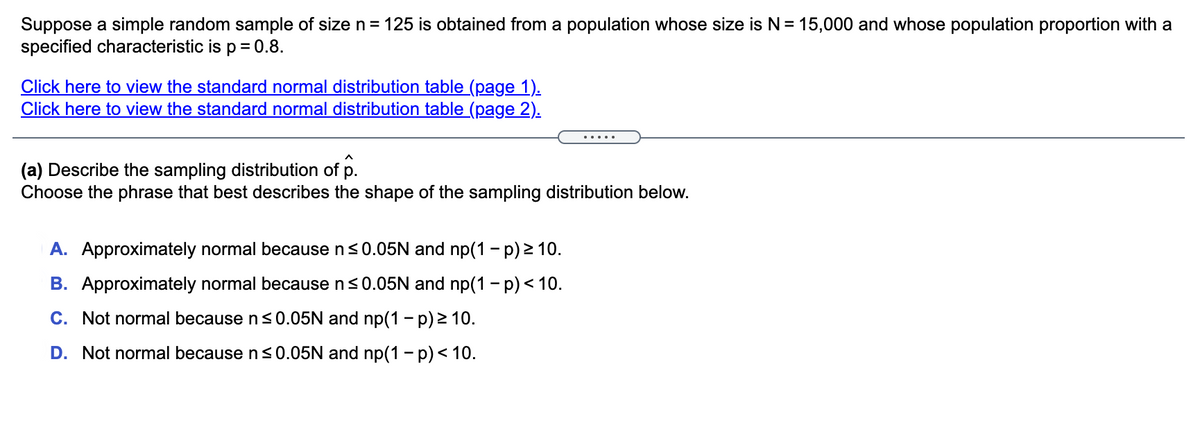
Transcribed Image Text:Suppose a simple random sample of size n= 125 is obtained from a population whose size is N= 15,000 and whose population proportion with a
specified characteristic is p = 0.8.
Click here to view the standard normal distribution table (page 1).
Click here to view the standard normal distribution table (page 2).
(a) Describe the sampling distribution of p.
Choose the phrase that best describes the shape of the sampling distribution below.
A. Approximately normal because n<0.05N and np(1 - p) 2 10.
B. Approximately normal because n<0.05N and np(1 - p) < 10.
C. Not normal because n <0.05N and np(1 – p) > 10.
D. Not normal because ns0.05N and np(1 - p) < 10.
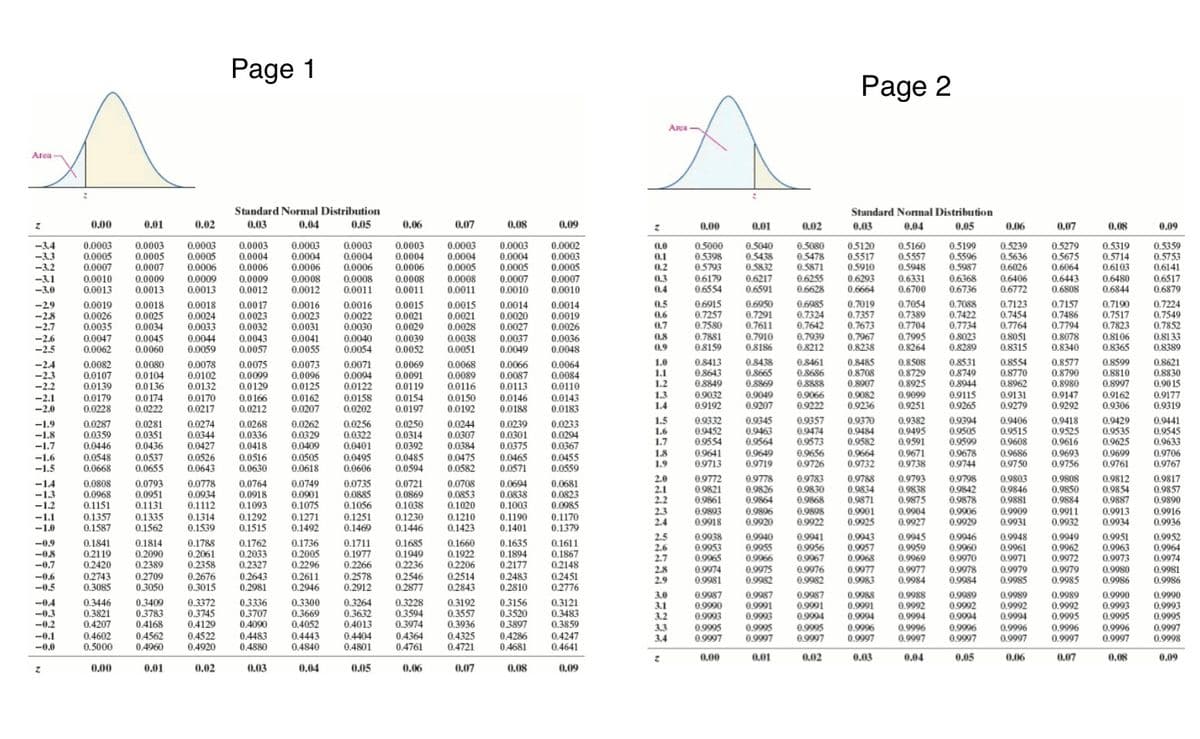
Transcribed Image Text:Page 1
Page 2
Aca
Area
Standard Normal Distribution
Standard Nomal Distribution
0,00
0.01
0.02
0.03
0.04
0.05
0.06
0.07
0.08
0.09
0.00
0.01
0.02
0.03
0.04
0.05
0.06
0,07
0.08
0.09
0.0003
0.0005
0.0007
0.0003
0.0004
0.0006
0.0009
0.0012
0.0003
0.0004
0.0006
0.0003
0.0004
-3.4
-3.3
-3.2
0.0003
0.0004
0.0005
0.0008
0.0011
0.0003
0.0004
0.0005
0,0007
0.0010
0.0002
0.0003
0.0005
0.5040
0.5438
0.5832
0.6217
0.6591
0.5080
0.5478
0.5871
0.6255
0.6628
0.5120
0.5517
0.5910
0.5160
0.5557
0.5948
0.6331
0.6700
0,5199
0.5596
0.5987
0.6368
0.6736
0.5239
0.5636
0.6026
0.6406
0.6772
0.5319
0.5714
0.6103
0.6480
0.6844
0.5359
0.5753
0,6141
0.0003
0.0005
0.0003
0.0005
0.0003
0.0004
0.0006
0.0
0.1
0.2
0.3
0.4
0.5000
0.5398
0.5793
0,6179
0.6554
0.5279
0.5675
0.6064
0.0007
0.0006
0.0006
-3.1
-30
0.0010
0.0013
0.0009
0.0013
0,0009
0.0013
0.0008
0.0012
0.0008
0.0011
0.6293
0.6664
0.6443
0.6808
0,6517
0.6879
0.0008
0.0007
0.0011
0.0010
0.0015
0.0021
0.0029
0.0039
0.0052
0.6915
0.7257
0.7580
0.7881
08159
0.6950
0.7291
0.7611
0.7910
0.8186
0.6985
0.7324
0.7642
0.7939
0.8212
0.7019
0.7357
0.7673
0.7967
0.8238
0.7054
0.7389
0.7704
0.7995
0.8264
0.7088
0.7422
0.7734
0.8023
0.8289
0.7123
0.7454
0.7764
0.8051
0.8315
0.7190
0,7517
0.7823
0.8106
0.8365
0.7224
0.7549
0.7852
0.8133
0.8389
0.5
0.7157
0.7486
0.7794
0.8078
0.8340
-29
0.0019
0.0026
0.0018
0.0025
0.0018
0.0024
0.0017
0.0023
0.0032
0.0043
0.0057
0.0016
0.0023
0.0016
0,0022
0.0030
0.0040
0.0054
0.0015
0.0021
0.0028
0.0038
0.0051
0.0014
0,0020
0.0014
0.0019
0.0026
-28
0.6
0.0035
0.0047
0.0062
0,0031
0.0041
0.0055
0.0027
0.0037
0.0049
-2.7
0.7
0.0033
0.0044
0.0059
0.0034
0.0036
0.0048
0.8
0.0045
0.0060
-26
-2.5
0.9
0.8485
0.8708
0.8438
0.8665
0.8869
0.9049
0.9207
0.8461
0.8686
0.8888
0.9066
0.9222
0.8508
0.8729
0.8925
0.9099
0.9251
0.8531
08749
0.8944
0.9115
0.9265
0.8554
0.8770
0.8962
0.9131
0.9279
0.8577
0.8790
0.8980
0.9147
0.9292
0.8599
0.8810
0.8997
0,9162
0.9306
0.8621
0.8830
0.90 15
0.9177
1.0
0.8413
0.8643
0.8849
09032
0,9192
-2.4
0.0082
0.0107
0.0139
0.0179
0.0228
0.0080
0.0104
0.0136
0.0174
0.0222
0.0078
0.0102
0,0132
0.0170
0.0217
0.0075
0.0099
0.0129
0.0166
0.0212
0.0073
0.0096
0.0125
0.0162
0.0207
0.0071
0.0094
0.0122
0.0158
0.0202
0.0069
0.0091
0.0119
0.0154
0.0197
0.0068
0.0089
0.0116
0.0150
0.0192
0.0066
0.0087
0.0113
0.0064
0.0084
0.0110
0,0143
0.0183
1.1
1.2
1.3
1.4
0.8907
-2.2
-2.1
-2.0
0.0146
0.0188
0.9082
0.9236
0,9319
0.0287
0.0359
0.0446
0.0548
0.0668
0.0281
0.0351
0.0436
0.0256
0.0322
0.0401
0.0495
0.0606
0.0735
0.0885
0.1056
1.5
1.6
1.7
0.9332
09452
0.9554
0.9641
0.9713
0.9345
0.9463
0.9564
0.9649
0.9719
0.9357
0.9474
0.9573
0.9656
0.9726
0.9370
0.9484
0.9582
0.9664
0.9732
0.9382
0.9495
0.9591
0.9671
0.9738
0.9394
0.9505
0.9599
0.9678
0.9744
0.9406
0.9515
0.9608
0.9686
0.9750
0.9418
0.9525
0.9616
0.9693
0.9756
0.9429
0.9535
0.9625
0.9699
0.9761
0.9441
0.9545
0.9633
0.9706
0.9767
-1.9
-1.8
-1.7
0.0268
0.0336
0.0418
0.0516
0.0630
0.0262
0.0329
0.0409
0.0505
0.0618
0.0250
0.0314
0.0392
0.0485
0.0594
0.0244
0.0307
0.0384
0.0475
0.0582
0.0239
0.0301
0.0375
0.0465
0.0571
0.0233
0.0294
0.0367
0.0274
0.0344
0.0427
0.0526
0.0643
0.0537
0.0655
1.8
1.9
-1.6
0.0455
-1.5
0.0559
2.0
2.1
2.2
2.3
2.4
09772
0.9821
0.9861
0.9893
0.9918
0.9778
0.9826
0,9864
0,9806
0,9783
0.9830
0,9868
0.9898
0.9922
0.9788
0.9834
0.9871
0.9901
0.9925
0.9793
0.9838
0.9875
0.9904
0.9927
0.9812
0.9854
0,9887
0.9913
0.9934
0.9817
0.9857
0.9890
0.9916
0,9936
0.9798
0.9803
0.9846
0.9881
0.9909
0.9931
0.9808
0.0808
0.0968
0.1151
0.1357
0.1587
0.0793
0.0951
0.1131
0,1335
0.1562
0.0778
0.0934
0.1112
0.1314
0.1539
0.0764
0.0918
0.1093
0.1292
0.1515
0.0749
0.0901
0.1075
0.1271
0.1492
0.0721
0.0869
0.1038
0.1230
0.1446
0.0708
0.0853
0.1020
0.1210
0.1423
0.0694
0.0838
0.1003
0.1190
0.1401
0,0681
0.0823
0.0985
0.1170
0.1379
-14
0.9842
0.9878
-1.3
-12
-1.1
-1.0
0.9850
0.9884
0.9911
0.9932
0.1251
0.1469
0.9906
0.9929
0.9920
0.9945
0.9959
0.9969
0.9977
0.9984
2.5
2.6
0,9938
0.9953
0,9065
0.9974
0.9981
0,9940
0,9055
0,9941
0,9056
0,9043
0.1788
0.2061
0.2358
0.2676
0.3015
0.1736
0.2005
0.2296
0,2611
0.2946
0.1711
0.1977
0.2266
0.2578
0.2912
0.1685
0.1949
0.2236
0.2546
0.2877
0.1635
0.1894
0,2177
0.2483
0.2810
0,9946
0.9960
0.9970
0.9978
0.9984
0.9948
0.9961
0.9971
0.9979
0.9985
0.9949
0.9962
0.9972
0,9951
0.9963
0.9973
0.9980
0,9952
0.9964
0.9974
0.9981
-0.9
-08
0.1841
0.2119
0.2420
0.2743
0.3085
0.1814
0.2090
0.2389
0.1762
0.2033
0.2327
0.2643
0.2981
0.1660
0.1922
0.2206
0,2514
0.2843
0.1611
0.1867
0.2148
0.2451
0.2776
0.9967
0.9976
0.9982
0.9957
0.9968
0.9977
0.9983
2.7
0.9966
-0.7
-0.6
-0.5
0.2709
0.3050
2.8
2.9
0,9975
0.9982
0.9979
0.9985
0.9986
0.9986
0.9987
0.9990
0.9993
0.9995
0.9997
0.9987
0.9991
0.9993
0.9987
0.9991
0.9994
0.9995
0.9997
0.9988
0.9991
0.9994
0.9996
0.9997
0.9988
0.9992
0.9994
0.9996
0.9997
0.9989
0.9992
0.9994
0.9996
0.9997
0.9989
0.9992
0.9994
0.9996
0.9989
0.9992
0.9995
0.9996
0.9997
0.9990
0.9993
0.9995
0.9996
0.9997
0.9990
0.9993
0.9995
0.9997
0.9998
3.0
-0,4
-0.3
-0.2
-0.1
-0.0
0.3446
0.3821
0.4207
0.4602
0.5000
0,3400
0.3783
0.4168
0.4562
0.4960
0.3372
0.3745
0.4129
0.4522
0.4920
0.3336
0.3707
0.4090
0,4483
0.4880
0.3300
0.3669
0.4052
0.4443
0.4840
0.3264
0.3632
0.4013
0.3228
0.3594
0.3974
0.4364
0.4761
0.3192
0.3557
0.3936
0.4325
0.4721
0.3156
0.3520
0.3897
0,3121
0.3483
0.3859
3.1
3.2
3.3
3.4
0.9995
0.9997
0.4404
0.4801
0.4286
0.4681
0.4247
0.4641
0.9997
0,00
0,01
0.02
0.03
0.04
0.05
0.06
0.07
0.08
0.09
0,00
0.01
0.02
0.03
0.04
0.05
0.06
0,07
0.08
0.09
Expert Solution
This question has been solved!
Explore an expertly crafted, step-by-step solution for a thorough understanding of key concepts.

Step by step
Solved in 2 steps

Recommended textbooks for you
Glencoe Algebra 1, Student Edition, 9780079039897…
Algebra
ISBN:
9780079039897
Author:
Carter
Publisher:
McGraw Hill
Glencoe Algebra 1, Student Edition, 9780079039897…
Algebra
ISBN:
9780079039897
Author:
Carter
Publisher:
McGraw Hill