Suppose, a transportation company conducted a study to consider demand level of their transportation systems during the rush hour for 180 days and for this purpose, the following table was constructed to represent the results. Transportation Systems Demand Level Total Y Low A 22 Medium 42 92 High D E 46 Total 94 180 a. What is the probability of using transportation system X during the rush hour? Answer in exact fraction, or rounded to at least 4 decimal places b. What is the probability of using transportation system Y during the rush hour? Answer in exact fraction, or rounded to at least 4 decimal places c. What is the probability of using transportation system X when the demand level was high during the rush hour? Answer in exact fraction, or rounded to at least 4 decimal places d. What is the probability of using transportation system Y when the demand level was medium during the rush hour? Answer in exact fraction, or rounded to at least 4 decimal places
Suppose, a transportation company conducted a study to consider demand level of their transportation systems during the rush hour for 180 days and for this purpose, the following table was constructed to represent the results. Transportation Systems Demand Level Total Y Low A 22 Medium 42 92 High D E 46 Total 94 180 a. What is the probability of using transportation system X during the rush hour? Answer in exact fraction, or rounded to at least 4 decimal places b. What is the probability of using transportation system Y during the rush hour? Answer in exact fraction, or rounded to at least 4 decimal places c. What is the probability of using transportation system X when the demand level was high during the rush hour? Answer in exact fraction, or rounded to at least 4 decimal places d. What is the probability of using transportation system Y when the demand level was medium during the rush hour? Answer in exact fraction, or rounded to at least 4 decimal places

Chapter8: Sequences, Series,and Probability
Section8.7: Probability
Problem 11ECP: A manufacturer has determined that a machine averages one faulty unit for every 500 it produces....

Related questions
Question
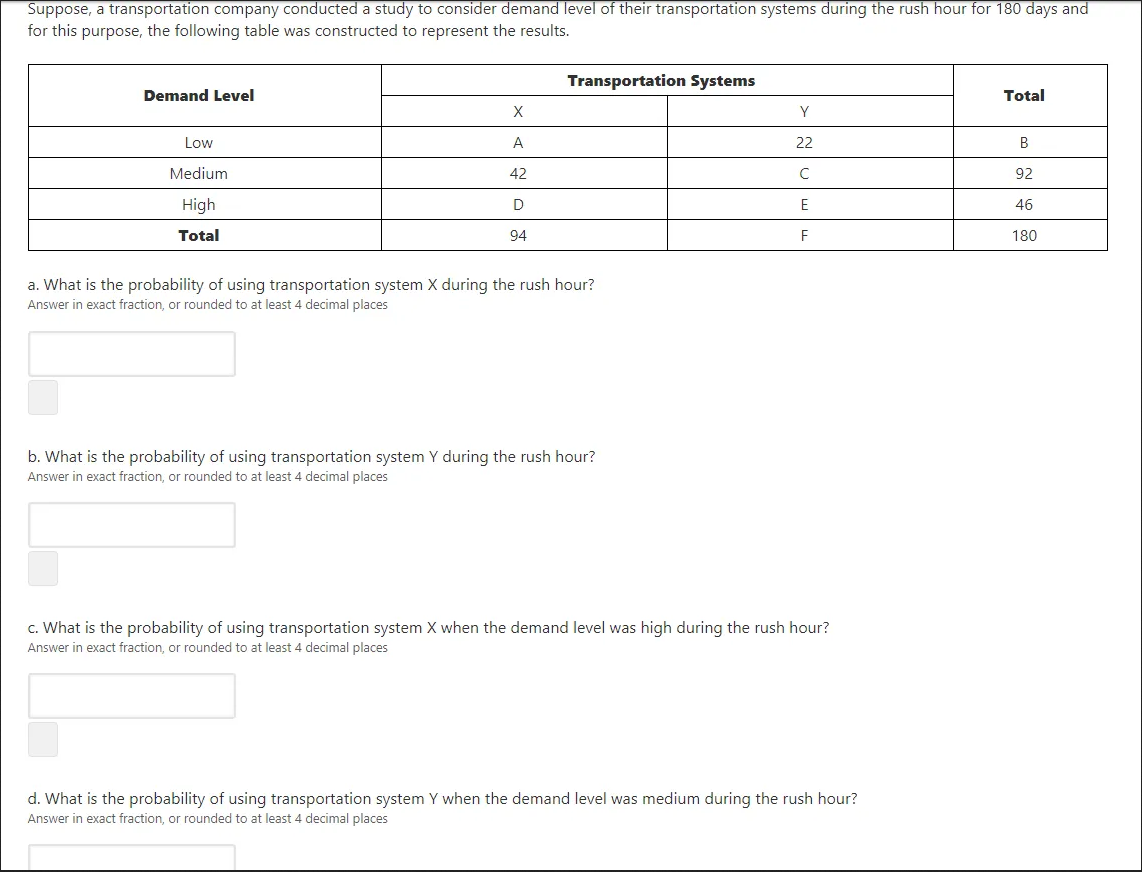
Transcribed Image Text:Suppose, a transportation company conducted a study to consider demand level of their transportation systems during the rush hour for 180 days and
for this purpose, the following table was constructed to represent the results.
Transportation Systems
Demand Level
Total
Y
Low
A
22
В
Medium
42
92
High
D
E
46
Total
94
180
a. What is the probability of using transportation system X during the rush hour?
Answer in exact fraction, or rounded to at least 4 decimal places
b. What is the probability of using transportation system Y during the rush hour?
Answer in exact fraction, or rounded to at least 4 decimal places
c. What is the probability of using transportation system X when the demand level was high during the rush hour?
Answer in exact fraction, or rounded to at least 4 decimal places
d. What is the probability of using transportation system Y when the demand level was medium during the rush hour?
Answer in exact fraction, or rounded to at least 4 decimal places
Expert Solution
This question has been solved!
Explore an expertly crafted, step-by-step solution for a thorough understanding of key concepts.

Step by step
Solved in 6 steps

Recommended textbooks for you

Algebra & Trigonometry with Analytic Geometry
Algebra
ISBN:
9781133382119
Author:
Swokowski
Publisher:
Cengage
Algebra & Trigonometry with Analytic Geometry
Algebra
ISBN:
9781133382119
Author:
Swokowski
Publisher:
Cengage