Suppose that a researcher studied the initials of married couples, to determine if people are more likely than chance (6.5%) to marry individuals whose last names begin with the same letter as their own. a) For a sample of 200 couples, 19 had last names which began with the same initial. Do these data indicate that the number of couples with the same initial is significantly different (alpha = 0.05) from what would be expected if couples were matched randomly? b) Repeat the test with a sample of 400 couples where 38 had the same last initial. c) You should find that you reject the null hypothesis in b) but not in a). How do you explain the fact that the two samples have the same proportions of same-to-different initials but lead to different conclusions?


Suppose that a researcher studied the initials of married couples, to determine if people are more likely than chance (6.5%) to marry individuals whose last names begin with the same letter as their own.
a) For a sample of 200 couples, 19 had last names which began with the same initial. Do these data indicate that the number of couples with the same initial is significantly different (alpha = 0.05) from what would be expected if couples were matched randomly?
b) Repeat the test with a sample of 400 couples where 38 had the same last initial.
c) You should find that you reject the null hypothesis in b) but not in a). How do you explain the fact that the two samples have the same proportions of same-to-different initials but lead to different conclusions?
a)
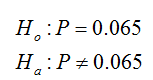
The null and alternative hypotheses are given below.
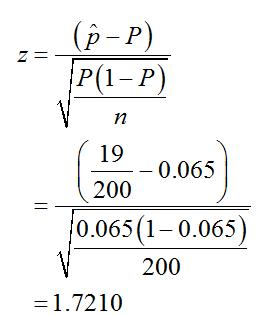
The sample proportion, p-cap is 0.095(=19/200) and sample size is 200.
Here, the z-test for single proportion is used.
The test statistic is given and calculated as follows.
Computation of p-value:
The p-value is 0.0853 using the EXCEL formula,
“=2*(1-NORM.S.DIST(1.7210,TRUE))”
Decision rule:
If p-value ≤ α, then reject the null hypothesis. Otherwise, fail to reject the null hypothesis.
Conclusion:
The level of significance is 0.05.
The P-value is 0.0853 and the significance level is 0.05.
Here, the P-value is greater than the significance level.
That is, 0.0853(=P-value) >0.05(=α).
Hence, the null hypothesis is not rejected.
Thus, there is insufficient evidence to conclude that the number of couples with the same initial is significantly different 0.065.
b)
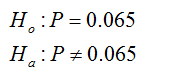
The null and alternative hypotheses are given below.
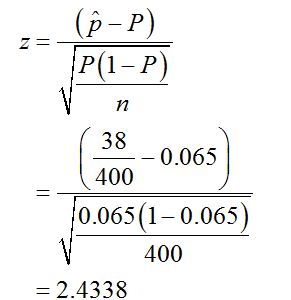
The sample proportion, p-cap is 0.095(=38/400) and sample size is 400.
Here, the z-test for single proportion is used.
The test statistic is given and calculated as follows.

Step by step
Solved in 5 steps with 4 images


