Suppose that labor is Valerie's önly Varlable cost and that SHe Has Use the orange points (square symbol) to plot Valerie's total cost curve on the following graph using the quantities from the preceding table 200 180 Total Cost 160 140 120 100 80 60 40 20 20 40 60 80 100 120 140 160 180 200 QUANTITY OF OUTPUT (Pizzas) True or False: The shape of the production function reflects the law of increasing marginal returns. O True O False TOTAL COST (Dollars) O O
Suppose that labor is Valerie's önly Varlable cost and that SHe Has Use the orange points (square symbol) to plot Valerie's total cost curve on the following graph using the quantities from the preceding table 200 180 Total Cost 160 140 120 100 80 60 40 20 20 40 60 80 100 120 140 160 180 200 QUANTITY OF OUTPUT (Pizzas) True or False: The shape of the production function reflects the law of increasing marginal returns. O True O False TOTAL COST (Dollars) O O

Principles of Economics 2e
2nd Edition
ISBN:9781947172364
Author:Steven A. Greenlaw; David Shapiro
Publisher:Steven A. Greenlaw; David Shapiro
Chapter7: Production, Costs, And Industry Structure
Section: Chapter Questions
Problem 42P: A small company that shovels sidewalks and driveways has 100 homes signed up for its services this...

Related questions
Question
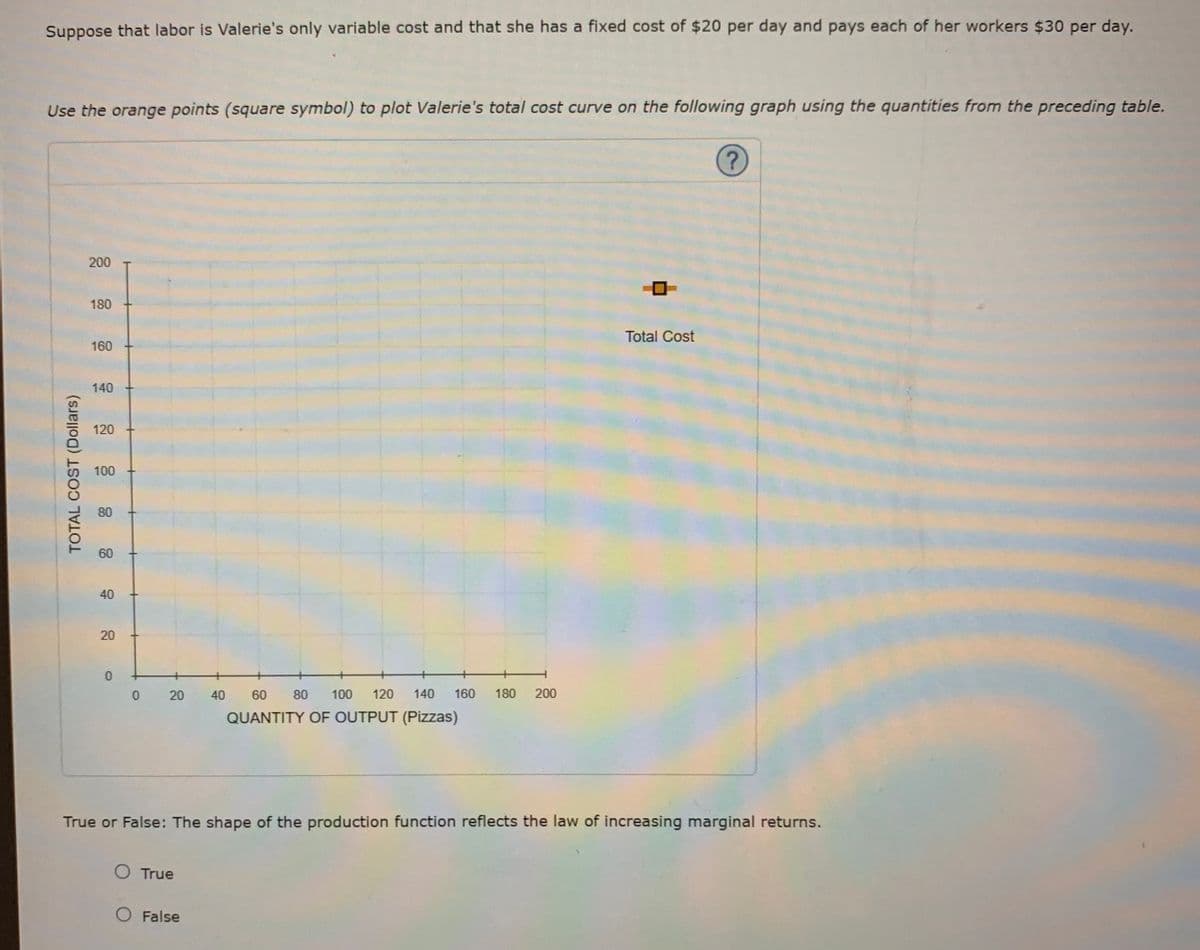
Transcribed Image Text:Suppose that labor is Valerie's only variable cost and that she has a fixed cost of $20 per day and pays each of her workers $30 per day.
Use the orange points (square symbol) to plot Valerie's total cost curve on the following graph using the quantities from the preceding table.
200
180
Total Cost
160
140
120
100
80
60
40
40 60
80
100
120
140
160
180
200
QUANTITY OF OUTPUT (Pizzas)
True or False: The shape of the production function reflects the law of increasing marginal returns.
O True
O False
20
20
TOTAL COST (Dollars)
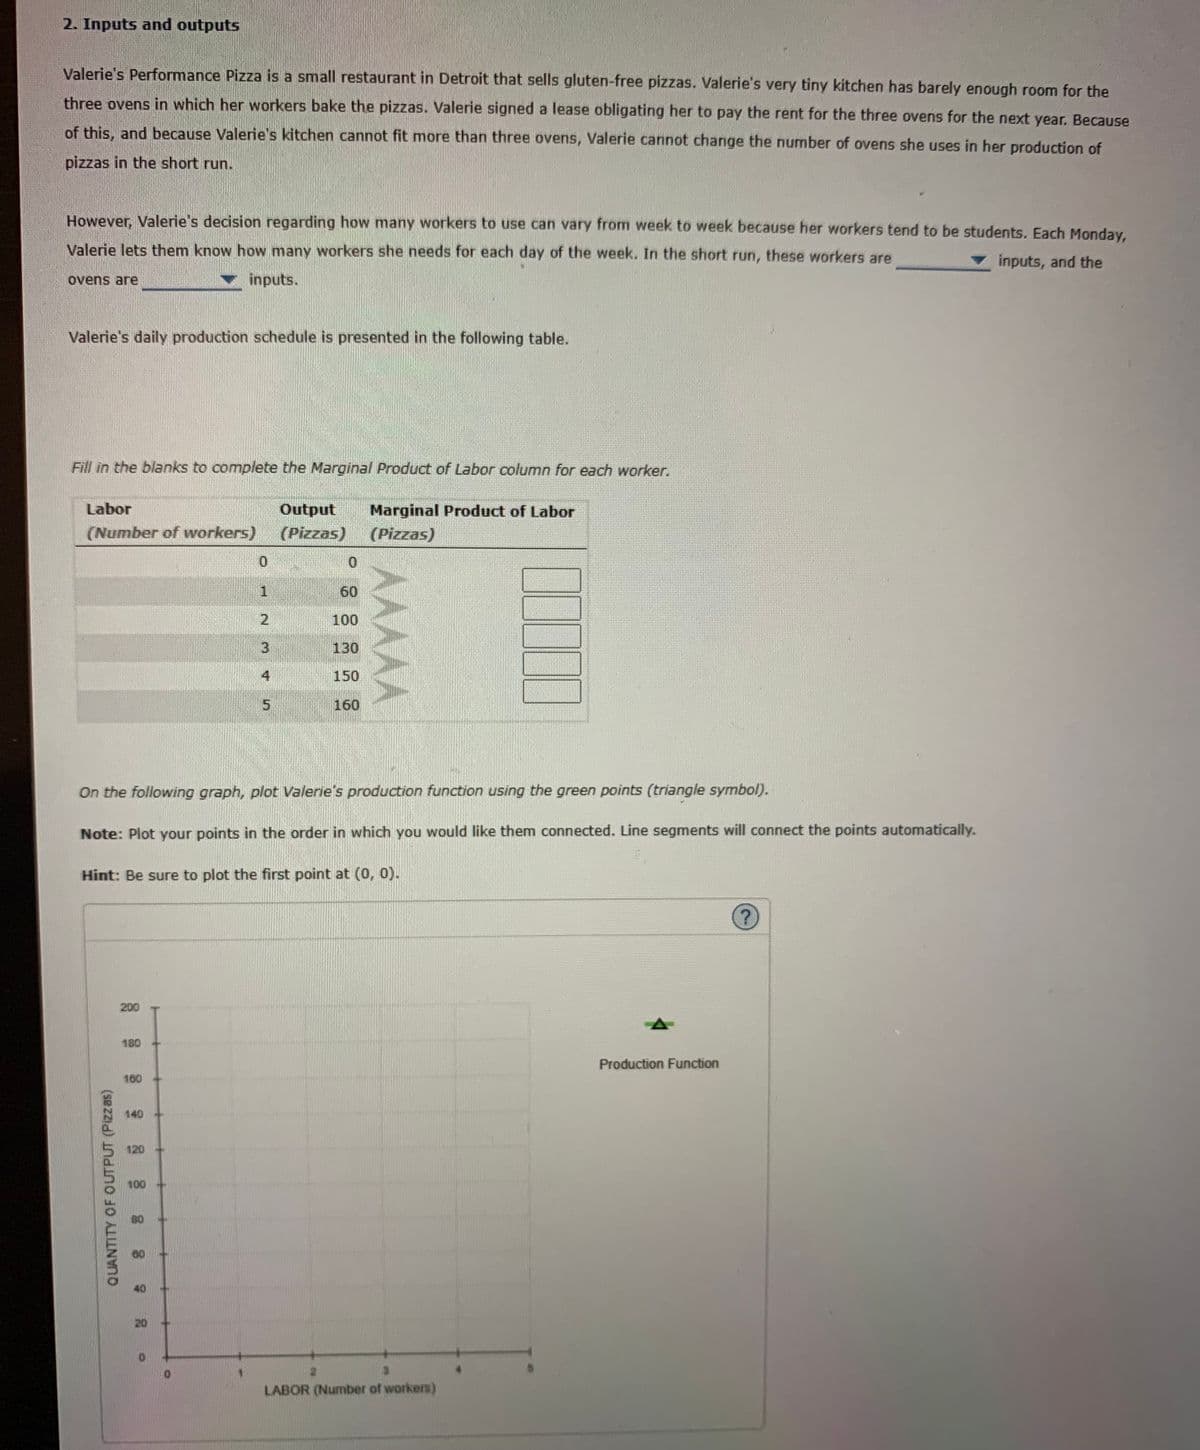
Transcribed Image Text:2. Inputs and outputs
Valerie's Performance Pizza is a small restaurant in Detroit that sells gluten-free pizzas. Valerie's very tiny kitchen has barely enough room for the
three ovens in which her workers bake the pizzas. Valerie signed a lease obligating her to pay the rent for the three ovens for the next year. Because
of this, and because Valerie's kitchen cannot fit more than three ovens, Valerie cannot change the number of ovens she uses in her production of
pizzas in the short run.
However, Valerie's decision regarding how many workers to use can vary from week to week because her workers tend to be students. Each Monday,
Valerie lets them know how many workers she needs for each day of the week. In the short run, these workers are
v inputs, and the
ovens are
inputs.
Valerie's daily production schedule is presented in the following table.
Fill in the blanks to complete the Marginal Product of Labor column for each worker.
Output
(Pizzas)
Labor
Marginal Product of Labor
(Pizzas)
(Number of workers)
60
2
100
130
4
150
160
On the following graph, plot Valerie's production function using the green points (triangle symbol).
Note: Plot your points in the order in which you would like them connected. Line segments will connect the points automatically.
Hint: Be sure to plot the first point at (0, 0).
200
180
Production Function
160
140
120
100
LABOR (Number of workers)
MAA
1.
QUANTITY OF OUTPUT (Pizzas)
Expert Solution
This question has been solved!
Explore an expertly crafted, step-by-step solution for a thorough understanding of key concepts.

This is a popular solution!

Trending now
This is a popular solution!

Step by step
Solved in 2 steps with 2 images

Recommended textbooks for you
Principles of Economics 2e
Economics
ISBN:
9781947172364
Author:
Steven A. Greenlaw; David Shapiro
Publisher:
OpenStax

Essentials of Economics (MindTap Course List)
Economics
ISBN:
9781337091992
Author:
N. Gregory Mankiw
Publisher:
Cengage Learning

Principles of Economics 2e
Economics
ISBN:
9781947172364
Author:
Steven A. Greenlaw; David Shapiro
Publisher:
OpenStax
Essentials of Economics (MindTap Course List)
Economics
ISBN:
9781337091992
Author:
N. Gregory Mankiw
Publisher:
Cengage Learning