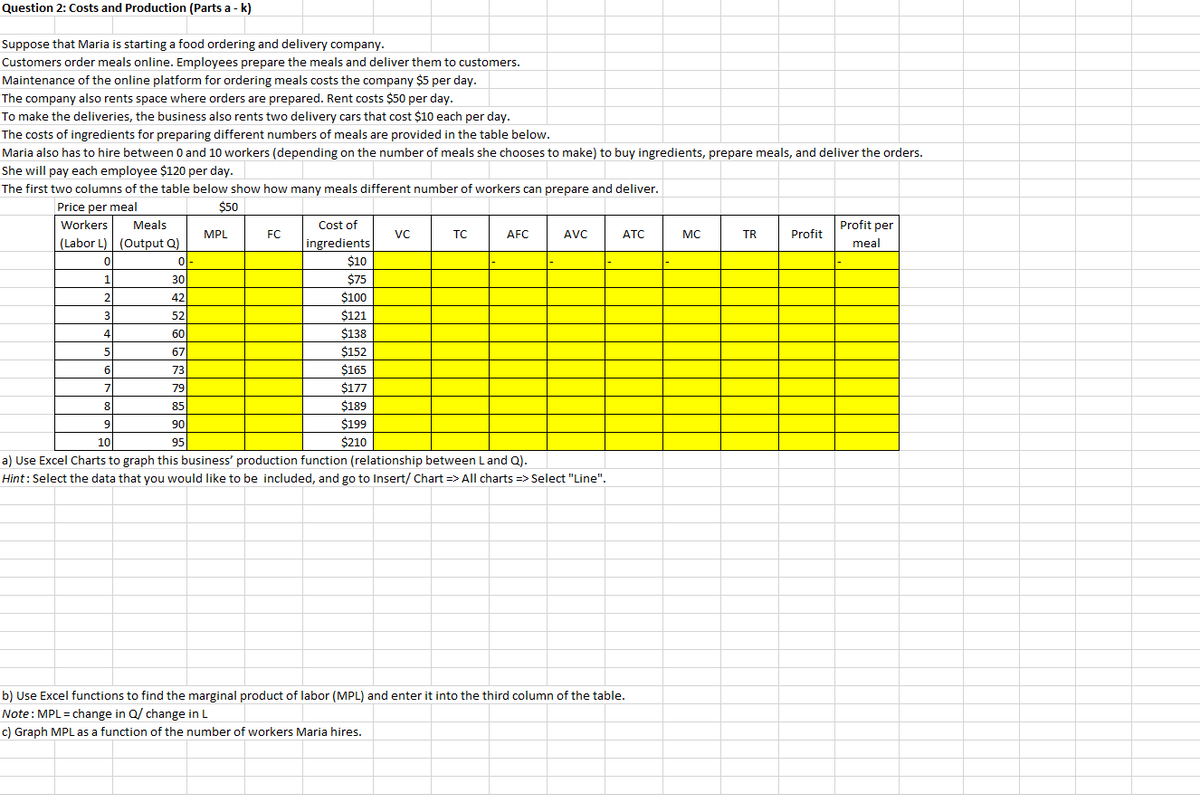
Suppose that Maria is starting a food ordering and delivery company. Customers order meals online. Employees prepare the meals and deliver them to customers. Maintenance of the online platform for ordering meals costs the company $5 per day. The company also rents space where orders are prepared. Rent costs $50 per day. To make the deliveries, the business also rents two delivery cars that cost $10 each per day. The costs of ingredients for preparing different numbers of meals are provided in the table below. Maria also has to hire between 0 and 10 workers (depending on the number of meals she chooses to make) to buy ingredients, prepare meals, and deliver the orders. She will pay each employee $120 per day. The first two columns of the table below show how many meals different number of workers can prepare and deliver. $50 Price per meal Workers Meals (Labor L) (Output Q) 0 0 1 2 3 4 5 6 30 42 52 60 67 73 MPL FC Cost of ingredients $10 $75 $100 $121 $138 $152 $165 $177 $189 $199 $210 VC TC AFC AVC 7 79 8 85 9 90 10 95 a) Use Excel Charts to graph this business' production function (relationship between L and Q). Hint: Select the data that you would like to be included, and go to Insert/ Chart => All charts => Select "Line". ATC b) Use Excel functions to find the marginal product of labor (MPL) and enter it into the third column of the table. Note: MPL = change in Q/ change in L c) Graph MPL as a function of the number of workers Maria hires. MC TR Profit Profit per meal
Suppose that Maria is starting a food ordering and delivery company. Customers order meals online. Employees prepare the meals and deliver them to customers. Maintenance of the online platform for ordering meals costs the company $5 per day. The company also rents space where orders are prepared. Rent costs $50 per day. To make the deliveries, the business also rents two delivery cars that cost $10 each per day. The costs of ingredients for preparing different numbers of meals are provided in the table below. Maria also has to hire between 0 and 10 workers (depending on the number of meals she chooses to make) to buy ingredients, prepare meals, and deliver the orders. She will pay each employee $120 per day. The first two columns of the table below show how many meals different number of workers can prepare and deliver. $50 Price per meal Workers Meals (Labor L) (Output Q) 0 0 1 2 3 4 5 6 30 42 52 60 67 73 MPL FC Cost of ingredients $10 $75 $100 $121 $138 $152 $165 $177 $189 $199 $210 VC TC AFC AVC 7 79 8 85 9 90 10 95 a) Use Excel Charts to graph this business' production function (relationship between L and Q). Hint: Select the data that you would like to be included, and go to Insert/ Chart => All charts => Select "Line". ATC b) Use Excel functions to find the marginal product of labor (MPL) and enter it into the third column of the table. Note: MPL = change in Q/ change in L c) Graph MPL as a function of the number of workers Maria hires. MC TR Profit Profit per meal

Chapter9: Production Functions
Section: Chapter Questions
Problem 9.3P

Related questions
Question
Transcribed Image Text:Question 2: Costs and Production (Parts a - k)
Suppose that Maria is starting a food ordering and delivery company.
Customers order meals online. Employees prepare the meals and deliver them to customers.
Maintenance of the online platform for ordering meals costs the company $5 per day.
The company also rents space where orders are prepared. Rent costs $50 per day.
To make the deliveries, the business also rents two delivery cars that cost $10 each per day.
The costs of ingredients for preparing different numbers of meals are provided in the table below.
Maria also has to hire between 0 and 10 workers (depending on the number of meals she chooses to make) to buy ingredients, prepare meals, and deliver the orders.
She will pay each employee $120 per day.
The first two columns of the table below show how many meals different number of workers can prepare and deliver.
Price per meal
$50
Workers
Meals
(Labor L) (Output Q)
0
0 ol
1
2
3
4
5
6
7
8
9
MPL
10
FC
Cost of
ingredients
$10
$75
$100
$121
$138
$152
30
42
52
60
67
73
79
85
90
95
a) Use Excel Charts to graph this business' production function (relationship between Land Q).
Hint: Select the data that you would like to be included, and go to Insert/ Chart => All charts => Select "Line".
$165
$177
VC
$189
$199
$210
TC
AFC
AVC
ATC
b) Use Excel functions to find the marginal product of labor (MPL) and enter it into the third column of the table.
Note: MPL = change in Q/ change in L
c) Graph MPL as a function of the number of workers Maria hires.
MC
TR
Profit
Profit per
meal
Expert Solution
This question has been solved!
Explore an expertly crafted, step-by-step solution for a thorough understanding of key concepts.

This is a popular solution!

Trending now
This is a popular solution!

Step by step
Solved in 4 steps with 4 images

Knowledge Booster


Learn more about
Need a deep-dive on the concept behind this application? Look no further. Learn more about this topic, economics and related others by exploring similar questions and additional content below.Recommended textbooks for you