Suppose that the graph below illustrates the demand for healthcare services given a coinsurance plan of 25%, what would be the expected change if the participant changed jobs and received a plan with 100% coinsurance?
Suppose that the graph below illustrates the demand for healthcare services given a coinsurance plan of 25%, what would be the expected change if the participant changed jobs and received a plan with 100% coinsurance?

Chapter6: Population Health
Section: Chapter Questions
Problem 6QAP

Related questions
Question
Suppose that the graph below illustrates the
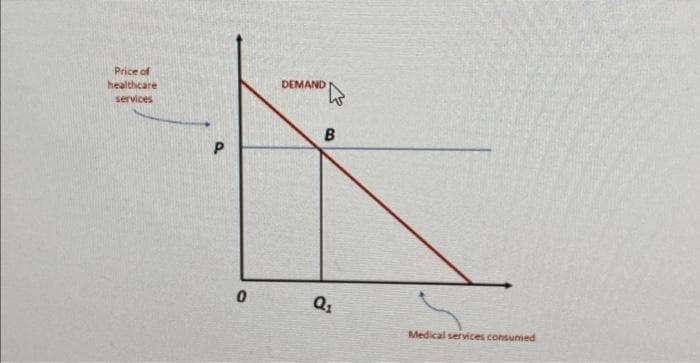
Transcribed Image Text:Price of
healthcare
services
P
0
DEMAND
B
Q₁
Medical services consumed
Expert Solution
This question has been solved!
Explore an expertly crafted, step-by-step solution for a thorough understanding of key concepts.

This is a popular solution!

Trending now
This is a popular solution!

Step by step
Solved in 3 steps

Knowledge Booster


Learn more about
Need a deep-dive on the concept behind this application? Look no further. Learn more about this topic, economics and related others by exploring similar questions and additional content below.Recommended textbooks for you

Microeconomics: Principles & Policy
Economics
ISBN:
9781337794992
Author:
William J. Baumol, Alan S. Blinder, John L. Solow
Publisher:
Cengage Learning

Principles of Economics 2e
Economics
ISBN:
9781947172364
Author:
Steven A. Greenlaw; David Shapiro
Publisher:
OpenStax
Microeconomics: Principles & Policy
Economics
ISBN:
9781337794992
Author:
William J. Baumol, Alan S. Blinder, John L. Solow
Publisher:
Cengage Learning
Principles of Economics 2e
Economics
ISBN:
9781947172364
Author:
Steven A. Greenlaw; David Shapiro
Publisher:
OpenStax