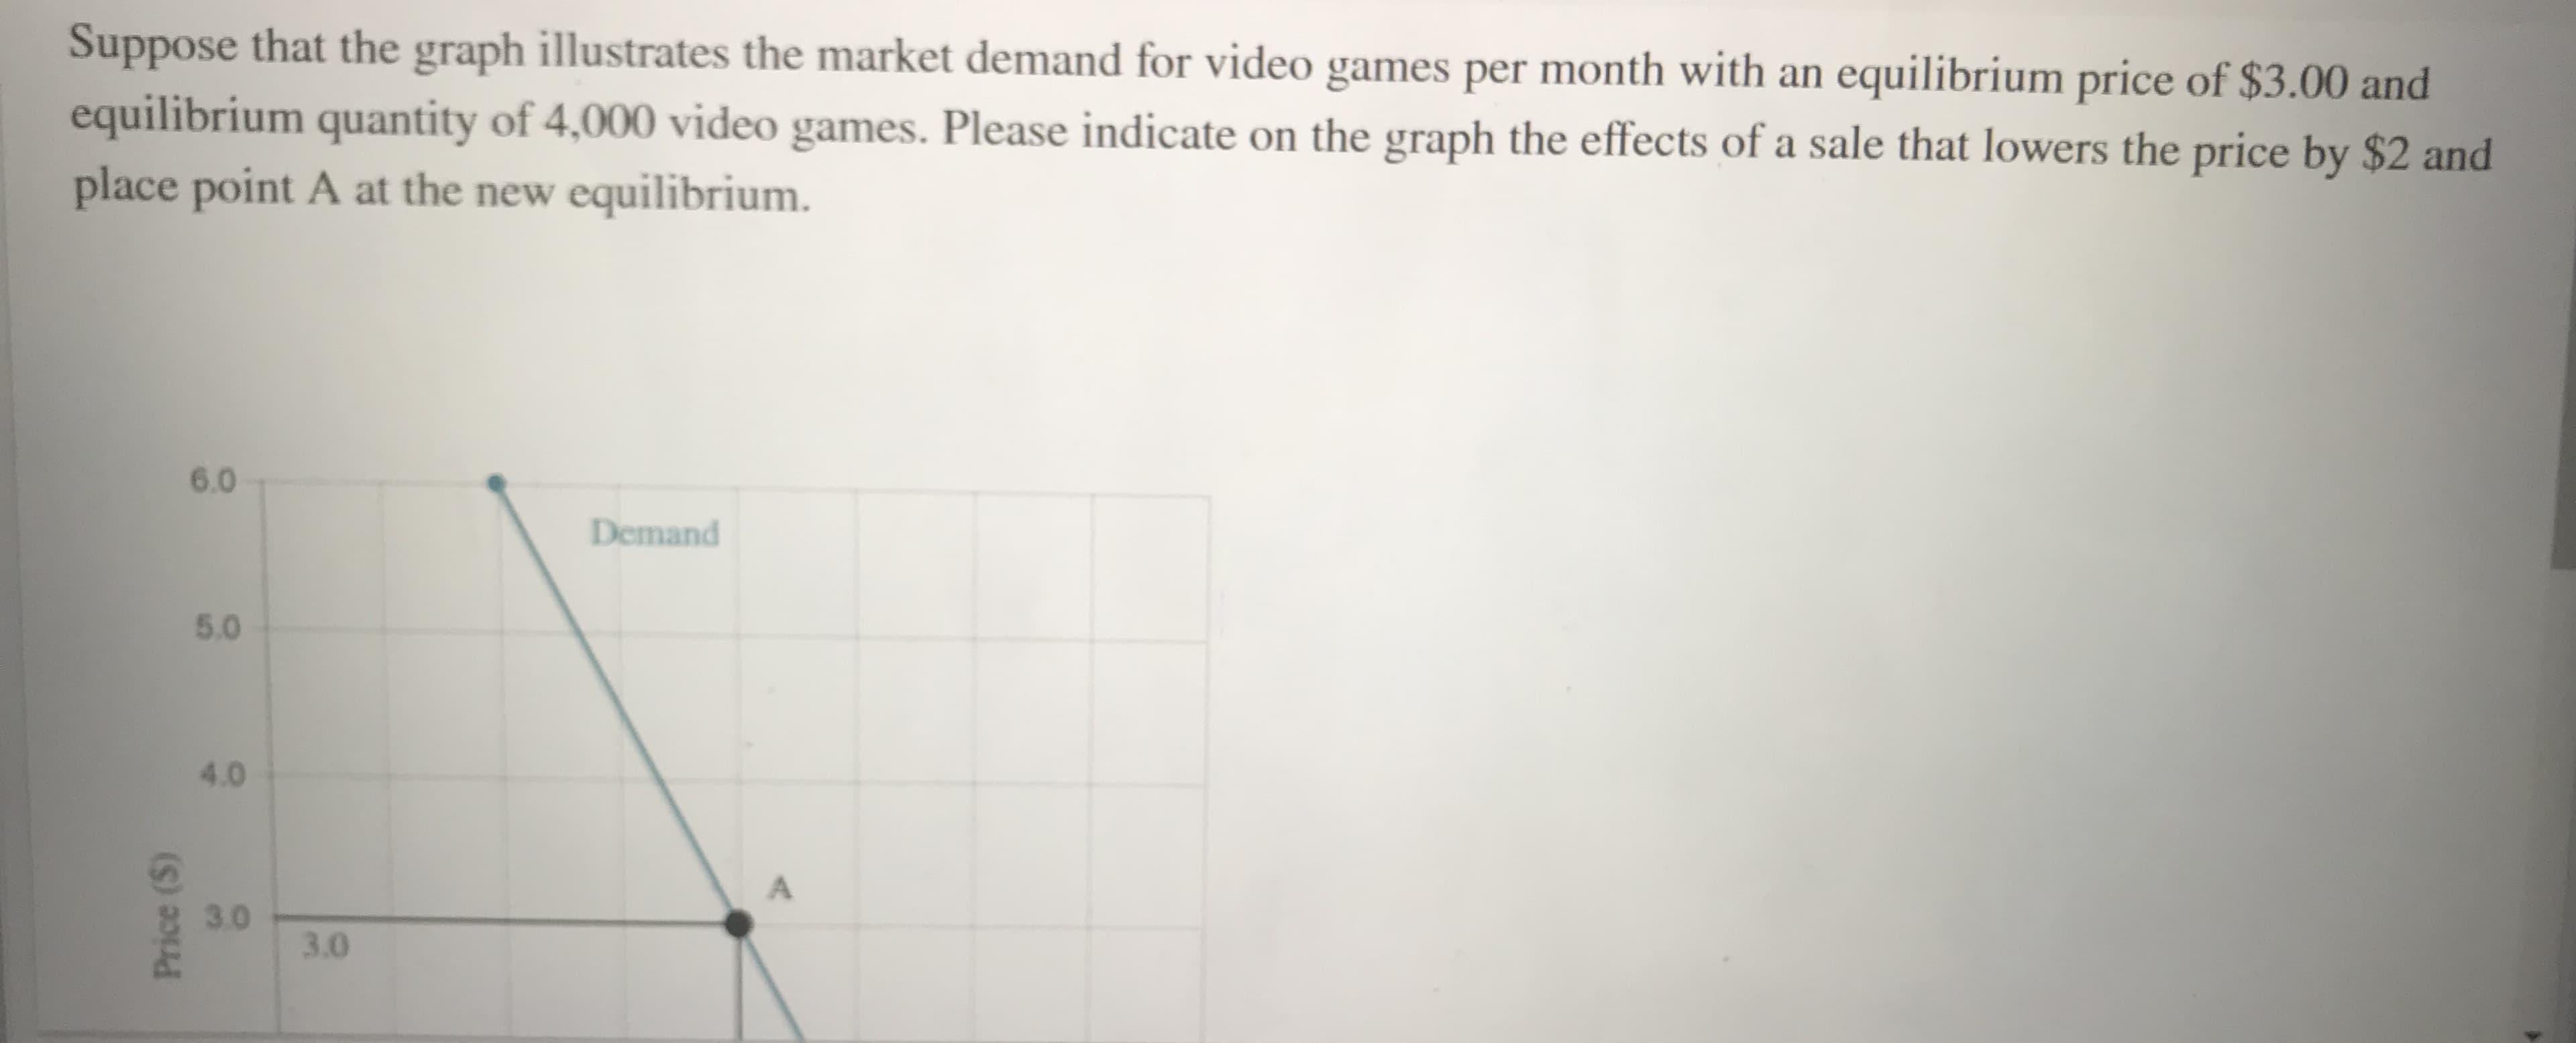
Suppose that the graph illustrates the market demand for video games per month with an equilibrium price of $3.00 and equilibrium quantity of 4,000 video games. Please indicate on the graph the effects of a sale that lowers the price by $2 and place point A at the new equilibrium. 6.0 Demand 5.0 4.0 3.0 3.0 Price ($)
Suppose that the graph illustrates the market demand for video games per month with an equilibrium price of $3.00 and equilibrium quantity of 4,000 video games. Please indicate on the graph the effects of a sale that lowers the price by $2 and place point A at the new equilibrium. 6.0 Demand 5.0 4.0 3.0 3.0 Price ($)

Chapter4: Markets In Action
Section: Chapter Questions
Problem 6SQ

Related questions
Question
Transcribed Image Text:Suppose that the graph illustrates the market demand for video games per month with an equilibrium price of $3.00 and
equilibrium quantity of 4,000 video games. Please indicate on the graph the effects of a sale that lowers the price by $2 and
place point A at the new equilibrium.
6.0
Demand
5.0
4.0
3.0
3.0
Price ($)

Expert Solution
This question has been solved!
Explore an expertly crafted, step-by-step solution for a thorough understanding of key concepts.

This is a popular solution!

Trending now
This is a popular solution!

Step by step
Solved in 2 steps with 1 images

Knowledge Booster


Learn more about
Need a deep-dive on the concept behind this application? Look no further. Learn more about this topic, economics and related others by exploring similar questions and additional content below.Recommended textbooks for you


Economics Today and Tomorrow, Student Edition
Economics
ISBN:
9780078747663
Author:
McGraw-Hill
Publisher:
Glencoe/McGraw-Hill School Pub Co
