Suppose that three drugs used to reduce systolic blood pressure are compared in a randomiz experiment in which four people use each drug for a month. The data for the reductions in sy blood pressure for the N = 12 participants follow. Drug 1 Drug 2 Drug 3 7 8 16 12 9. 5
Suppose that three drugs used to reduce systolic blood pressure are compared in a randomiz experiment in which four people use each drug for a month. The data for the reductions in sy blood pressure for the N = 12 participants follow. Drug 1 Drug 2 Drug 3 7 8 16 12 9. 5

Glencoe Algebra 1, Student Edition, 9780079039897, 0079039898, 2018
18th Edition
ISBN:9780079039897
Author:Carter
Publisher:Carter
Chapter10: Statistics
Section10.6: Summarizing Categorical Data
Problem 31PPS

Related questions
Question
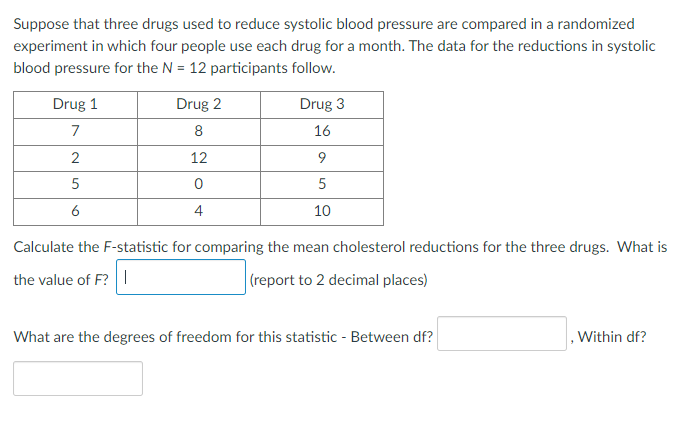
Transcribed Image Text:Suppose that three drugs used to reduce systolic blood pressure are compared in a randomized
experiment in which four people use each drug for a month. The data for the reductions in systolic
blood pressure for the N = 12 participants follow.
Drug 1
Drug 2
Drug 3
7
8
16
2
12
5
5
6
4
10
Calculate the F-statistic for comparing the mean cholesterol reductions for the three drugs. What is
the value of F? |
(report to 2 decimal places)
What are the degrees of freedom for this statistic - Between df?
.Within df?
Expert Solution
This question has been solved!
Explore an expertly crafted, step-by-step solution for a thorough understanding of key concepts.

This is a popular solution!

Trending now
This is a popular solution!

Step by step
Solved in 2 steps with 1 images

Recommended textbooks for you
Glencoe Algebra 1, Student Edition, 9780079039897…
Algebra
ISBN:
9780079039897
Author:
Carter
Publisher:
McGraw Hill
Glencoe Algebra 1, Student Edition, 9780079039897…
Algebra
ISBN:
9780079039897
Author:
Carter
Publisher:
McGraw Hill