Suppose the accompanying summary statistics for a measure of social marginality for samples of youths, young adults, adults, and seniors appeared in a research paper. The social marginality score measured actual and perceived social rejection, with higher scores indicating greater social rejection. Age Group Youths Sample Size x s 104 2.00 1.59 Young Adults 251 3.10 1.69 Adults Seniors 319 3.06 1.68 35 2.81 1.87 For purposes of this exercise, assume that it is reasonable to regard the four samples as representative of the U.S. population in the corresponding age groups and that the distributions of social marginality scores for these four groups are approximately normal with the same standard deviation. Is there evidence that the mean social marginality scores are not the same for all four age groups? Test the relevant hypotheses using a = 0.01. Calculate the test statistic. (Round your answer to two decimal places.) F = Use technology to find the P-value. (Round your answer to four decimal places.) P-value =
Suppose the accompanying summary statistics for a measure of social marginality for samples of youths, young adults, adults, and seniors appeared in a research paper. The social marginality score measured actual and perceived social rejection, with higher scores indicating greater social rejection. Age Group Youths Sample Size x s 104 2.00 1.59 Young Adults 251 3.10 1.69 Adults Seniors 319 3.06 1.68 35 2.81 1.87 For purposes of this exercise, assume that it is reasonable to regard the four samples as representative of the U.S. population in the corresponding age groups and that the distributions of social marginality scores for these four groups are approximately normal with the same standard deviation. Is there evidence that the mean social marginality scores are not the same for all four age groups? Test the relevant hypotheses using a = 0.01. Calculate the test statistic. (Round your answer to two decimal places.) F = Use technology to find the P-value. (Round your answer to four decimal places.) P-value =

Glencoe Algebra 1, Student Edition, 9780079039897, 0079039898, 2018
18th Edition
ISBN:9780079039897
Author:Carter
Publisher:Carter
Chapter10: Statistics
Section10.4: Distributions Of Data
Problem 19PFA

Related questions
Question
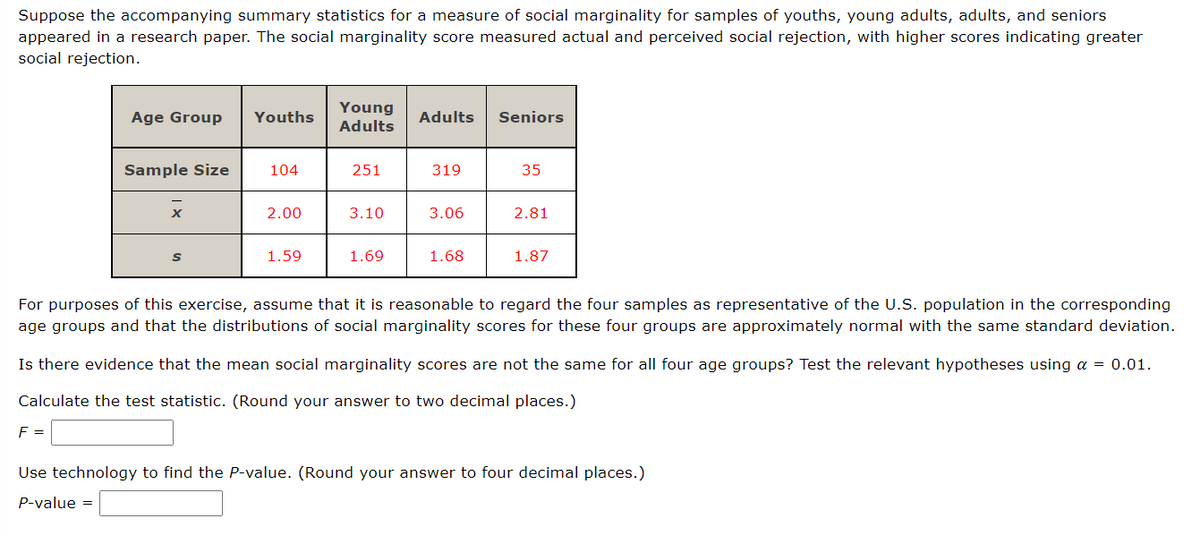
Transcribed Image Text:Suppose the accompanying summary statistics for a measure of social marginality for samples of youths, young adults, adults, and seniors
appeared in a research paper. The social marginality score measured actual and perceived social rejection, with higher scores indicating greater
social rejection.
Age Group Youths
Sample Size
F =
x
S
104
2.00
1.59
Young
Adults
251
3.10
1.69
Adults Seniors
319
3.06
1.68
35
2.81
1.87
For purposes of this exercise, assume that it is reasonable to regard the four samples as representative of the U.S. population in the corresponding
age groups and that the distributions of social marginality scores for these four groups are approximately normal with the same standard deviation.
Is there evidence that the mean social marginality scores are not the same for all four age groups? Test the relevant hypotheses using a = 0.01.
Calculate the test statistic. (Round your answer to two decimal places.)
Use technology to find the P-value. (Round your answer to four decimal places.)
P-value =
Expert Solution
This question has been solved!
Explore an expertly crafted, step-by-step solution for a thorough understanding of key concepts.

Step by step
Solved in 2 steps with 1 images

Recommended textbooks for you
Glencoe Algebra 1, Student Edition, 9780079039897…
Algebra
ISBN:
9780079039897
Author:
Carter
Publisher:
McGraw Hill
Glencoe Algebra 1, Student Edition, 9780079039897…
Algebra
ISBN:
9780079039897
Author:
Carter
Publisher:
McGraw Hill