Suppose the birth weights of full-term babies are normally distributed with mean 3300 grams and standard deviation a 500 grams Complete parts (a) through (c) below. C a a A A 2000 (b) Shade the region that represents the proportion of full-term babies who weigh more than 4300 grams. Choose the correct graph below. OA OB. OC. C 3300 TIM 2300 4300 (c) Suppose the area under the normal curve to the right of X 4300 is 00228 Provide an interpretation of this 3300 A 2000 3000 4300 x C 2500 3300 3800 A 3000 3300 4300 OD. Q C Q x (
Suppose the birth weights of full-term babies are normally distributed with mean 3300 grams and standard deviation a 500 grams Complete parts (a) through (c) below. C a a A A 2000 (b) Shade the region that represents the proportion of full-term babies who weigh more than 4300 grams. Choose the correct graph below. OA OB. OC. C 3300 TIM 2300 4300 (c) Suppose the area under the normal curve to the right of X 4300 is 00228 Provide an interpretation of this 3300 A 2000 3000 4300 x C 2500 3300 3800 A 3000 3300 4300 OD. Q C Q x (

Glencoe Algebra 1, Student Edition, 9780079039897, 0079039898, 2018
18th Edition
ISBN:9780079039897
Author:Carter
Publisher:Carter
Chapter10: Statistics
Section10.6: Summarizing Categorical Data
Problem 31PPS

Related questions
Question
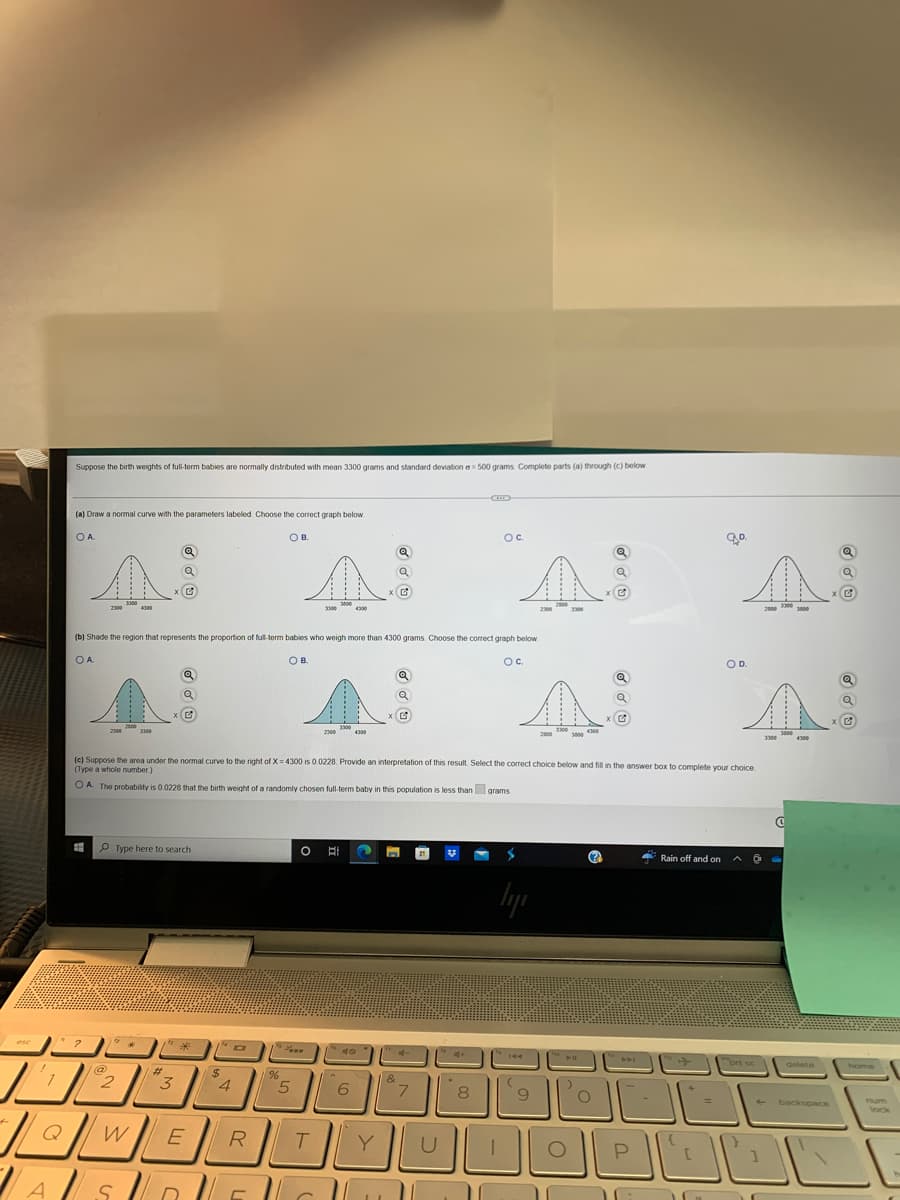
Transcribed Image Text:Suppose the birth weights of full-term babies are normally distributed with mean 3300 grams and standard deviation a 500 grams. Complete parts (a) through (c) below.
(a) Draw a normal curve with the parameters labeled. Choose the correct graph below.
OA
О в.
OC.
Q
Q
Q
Q
q
A
4
A
A
x G
3300
3800
2000
3300
2300
4300
3300
4300
2300
3300
2000
3000
(b) Shade the region that represents the proportion of full-term babies who weigh more than 4300 grams. Choose the correct graph below.
OA.
OB.
OC.
Q
Q
Q
A
x
2000
3300
2300
3300
2300
4300
2000
3300
3000 4300
3000
3300 4300
(c) Suppose the area under the normal curve to the right of X=4300 is 0.0228. Provide an interpretation of this result. Select the correct choice below and fill in the answer box to complete your choice.
(Type a whole number)
OA. The probability is 0.0228 that the birth weight of a randomly chosen full-term baby in this population is less than grams.
C
#
Type here to search
O B
2
V
(?)
Rain off and on
lyi
"*
**
esc
?
@
MP²
2
Q
TALELOU
А
#t
"
$
15 J
%
3
4
W E R
T
s n LELL
5
40
6
Y
II
" 4-
&
7
U
4+
8
9
PIL
)
80.
OD.
DA
O
=
9000
P
I
DE
5
brt sc
delete
backspace
Q
G
x ₂
num
Transcribed Image Text:1
Les
Pres
?
1
Q
A
Z
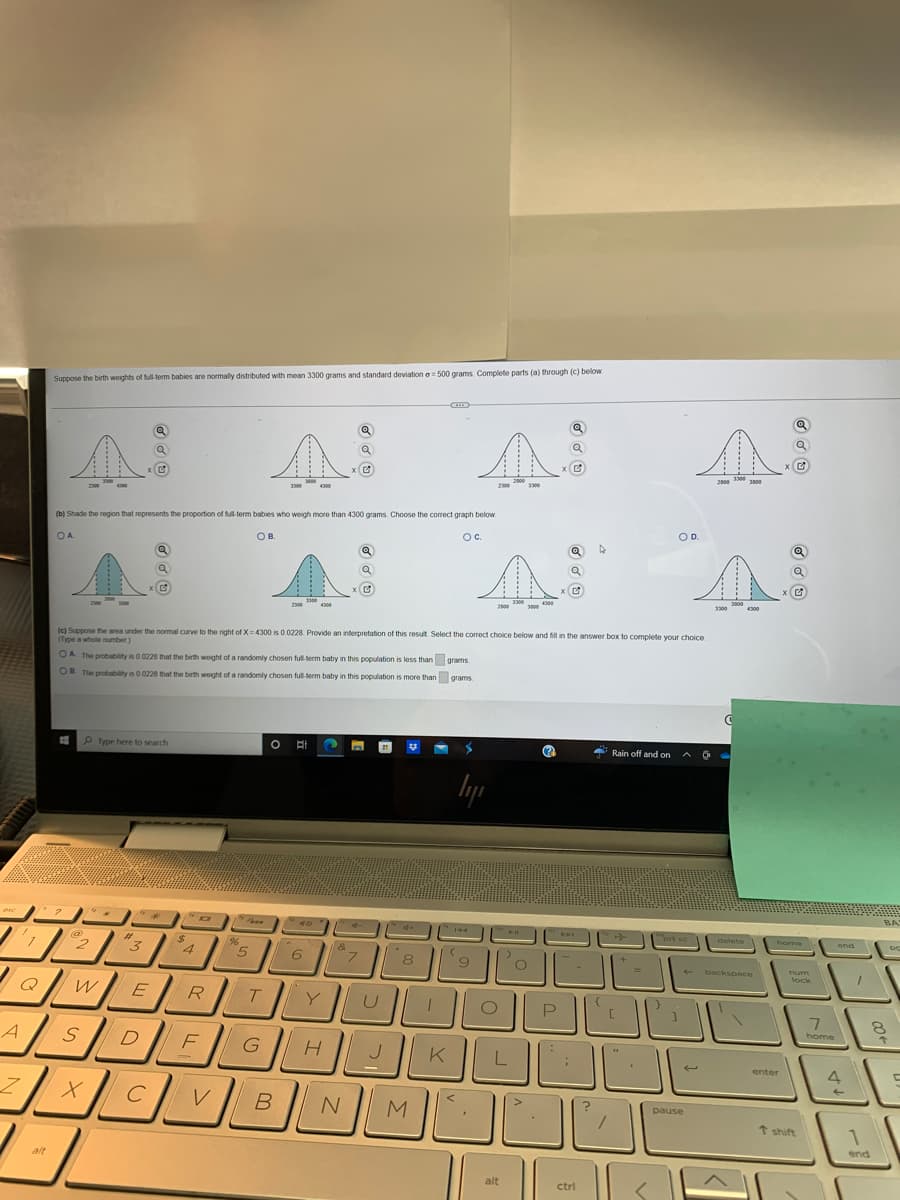
Suppose the birth weights of full-term babies are normally distributed with mean 3300 grams and standard deviation a 500 grams. Complete parts (a) through (c) below.
Q
Q
a
a
A
д
x L
3000
2500 3300 3500
3300
4300
2300
3300
(b) Shade the region that represents the proportion of full-term babies who weigh more than 4300 grams. Choose the correct graph below.
OA
OB.
ос.
Q
Q
a
A
A
x C
x G
2300
3300
4300
3300
4300
3500
2000
3500
3300
4300
(c) Suppose the area under the normal curve to the right of X=4300 is 0.0228. Provide an interpretation of this result. Select the correct choice below and fill in the answer box to complete your choice.
(Type a whole number)
OA. The probability is 0.0228 that the birth weight of a randomly chosen full-term baby in this population is less than
OB. The probability is 0.0228 that the birth weight of a randomly chosen full-term baby in this population is more than
grams.
grams.
C
#
Type here to search
O BI 2 n
2
Rain off and on
" **
40
alt
@
de
2
W.
#
#7
3
$
4
%6
5
E
R
S
D
F
XCV
&
B N
ly
4+
DIE
+
6
7
8
O
T
MUNOBOD
G H
J
K
L
;
-
pause
ctrl
M
2500
alt
Q
411
O D.
"prt sc
delete
4 backspace
Q
x G
home
enter
num
lock
7
home
end
4
←
1
1
end
BA
8
C
Expert Solution
This question has been solved!
Explore an expertly crafted, step-by-step solution for a thorough understanding of key concepts.

This is a popular solution!

Trending now
This is a popular solution!

Step by step
Solved in 2 steps with 2 images

Recommended textbooks for you
Glencoe Algebra 1, Student Edition, 9780079039897…
Algebra
ISBN:
9780079039897
Author:
Carter
Publisher:
McGraw Hill
Glencoe Algebra 1, Student Edition, 9780079039897…
Algebra
ISBN:
9780079039897
Author:
Carter
Publisher:
McGraw Hill