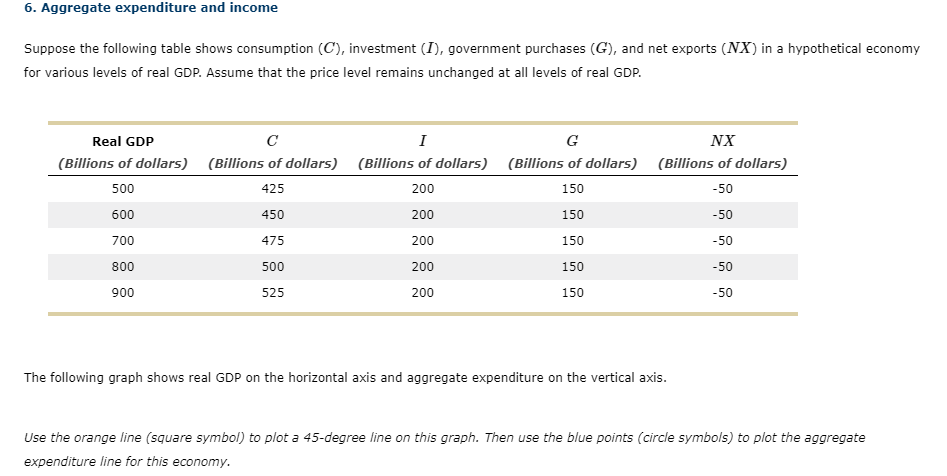
Suppose the following table shows consumption (C), investment (I), government purchases (G), and net exports (NX) in a hypothetical economy for various levels of real GDP. Assume that the price level remains unchanged at all levels of real GDP. Real GDP C I G NX (Billions of dollars) (Billions of dollars) (Billions of dollars) (Billions of dollars) (Billions of dollars) 500 425 200 150 -50 600 450 200 150 -50 700 475 200 150 -50 800 500 200 150 -50 900 525 200 150 -50 The following graph shows real GDP on the horizontal axis and aggregate expenditure on the vertical axis.
Suppose the following table shows consumption (C), investment (I), government purchases (G), and net exports (NX) in a hypothetical economy for various levels of real GDP. Assume that the price level remains unchanged at all levels of real GDP. Real GDP C I G NX (Billions of dollars) (Billions of dollars) (Billions of dollars) (Billions of dollars) (Billions of dollars) 500 425 200 150 -50 600 450 200 150 -50 700 475 200 150 -50 800 500 200 150 -50 900 525 200 150 -50 The following graph shows real GDP on the horizontal axis and aggregate expenditure on the vertical axis.

Managerial Economics: Applications, Strategies and Tactics (MindTap Course List)
14th Edition
ISBN:9781305506381
Author:James R. McGuigan, R. Charles Moyer, Frederick H.deB. Harris
Publisher:James R. McGuigan, R. Charles Moyer, Frederick H.deB. Harris
Chapter5: Business And Economic Forecasting
Section: Chapter Questions
Problem 1.1CE

Related questions
Question
plot graph based on instructions in photo
Transcribed Image Text:6. Aggregate expenditure and income
Suppose the following table shows consumption (C), investment (I), government purchases (G), and net exports (NX) in a hypothetical economy
for various levels of real GDP. Assume that the price level remains unchanged at all levels of real GDP.
Real GDP
C
I
G
NX
(Billions of dollars) (Billions of dollars) (Billions of dollars) (Billions of dollars) (Billions of dollars)
500
425
200
150
-50
600
450
200
150
-50
700
475
200
150
-50
800
500
200
150
-50
900
525
200
150
-50
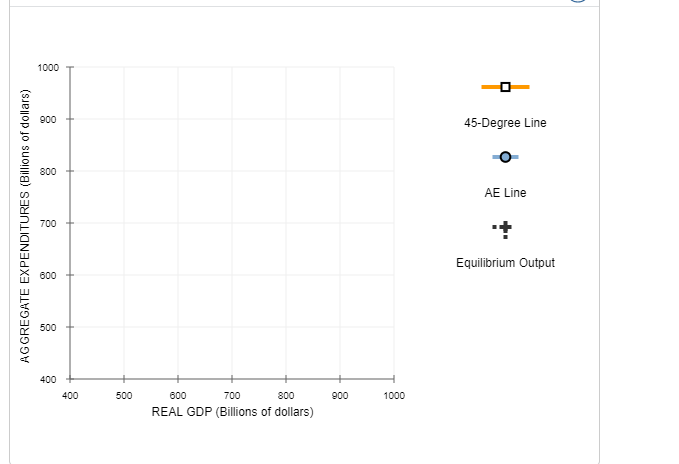
The following graph shows real GDP on the horizontal axis and aggregate expenditure on the vertical axis.
orange line (square symbol) to plot a 45-degree line on this graph.
en use the
points (circle symbols) to plot
Use
aggregate
expenditure line for this economy.
Transcribed Image Text:1000
900
45-Degree Line
800
AE Line
700
Equilibrium Output
600
500
400
400
500
600
700
800
900
1000
REAL GDP (Billions of dollars)
AGGREGATE EXPENDITURES (Billions
dollars)
Expert Solution
This question has been solved!
Explore an expertly crafted, step-by-step solution for a thorough understanding of key concepts.

This is a popular solution!

Trending now
This is a popular solution!

Step by step
Solved in 2 steps with 1 images

Knowledge Booster


Learn more about
Need a deep-dive on the concept behind this application? Look no further. Learn more about this topic, economics and related others by exploring similar questions and additional content below.Recommended textbooks for you
Managerial Economics: Applications, Strategies an…
Economics
ISBN:
9781305506381
Author:
James R. McGuigan, R. Charles Moyer, Frederick H.deB. Harris
Publisher:
Cengage Learning


Managerial Economics: Applications, Strategies an…
Economics
ISBN:
9781305506381
Author:
James R. McGuigan, R. Charles Moyer, Frederick H.deB. Harris
Publisher:
Cengage Learning