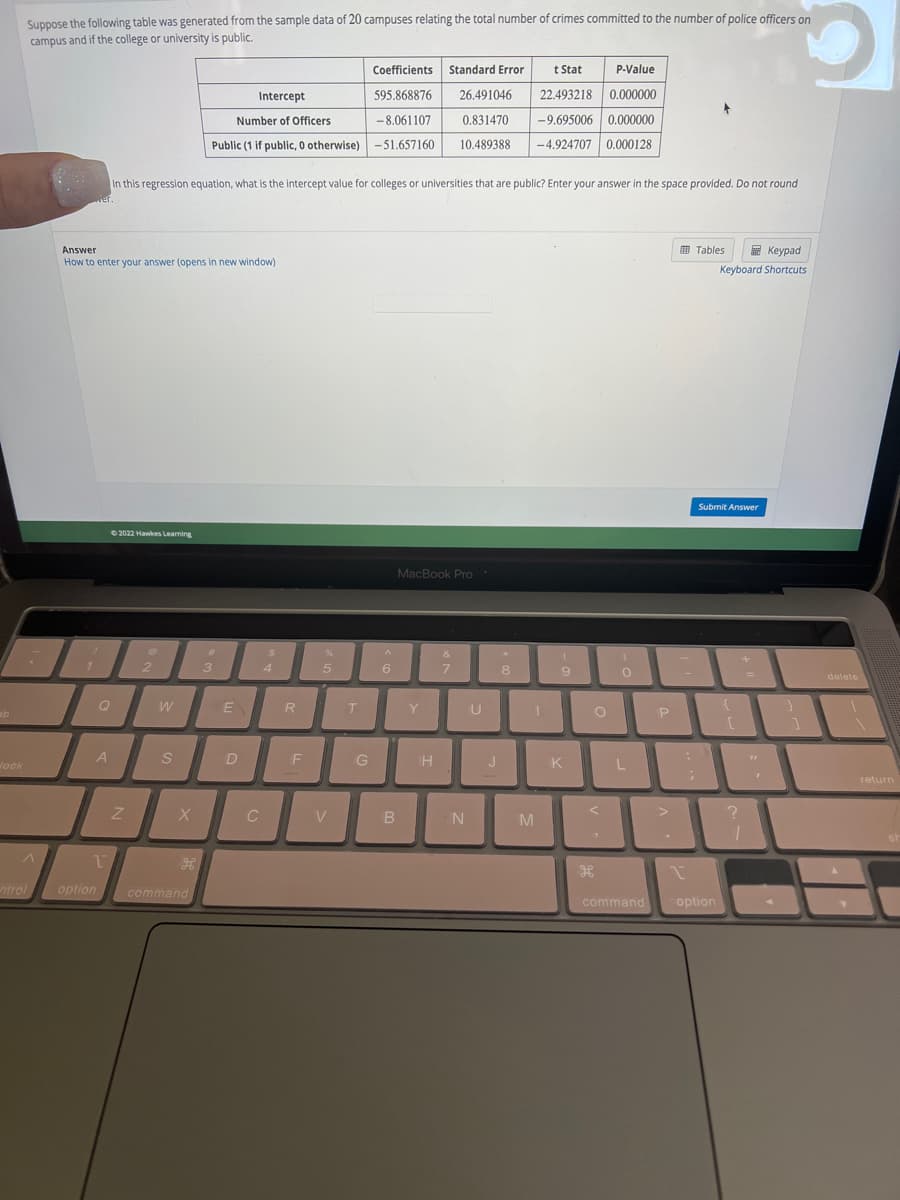
Suppose the following table was generated from the sample data of 20 campuses relating the total number of crimes committed to the number of police officers on campus and if the college or university is public. Intercept Number of Officers Public (1 if public, 0 otherwise) Coefficients Standard Error 595.868876 -8.061107 -51.657160 Answer How to enter your answer (opens in new window) 26.491046 0.831470 10.489388 t Stat P-Value 22.493218 0.000000 -9.695006 0.000000 -4.924707 0.000128 In this regression equation, what is the intercept value for colleges or universities that are public? Enter your answer in the space provided. Do not round S Tables Keypad Keyboard Shortcuts
Q: QUESTION 10 You are interested in seeing whether emotions impact decision making. You have three…
A: Formula for the mean square within (MSW) samples : MSW=SSWdfW Where , SSW is the sum of square…
Q: A researcher is interested in finding a 90% confidence interval for the mean number minutes students…
A: Given that, a) To compute the confidence interval use a t-distribution Reason: Since the population…
Q: The least-squares regression equation is y=649.1x + 16,025 where y is the median income and x is the…
A: From given data regression equation is y^=649.1x+16025
Q: what is the total degrees of freedom for this data?
A: Question 16: The data shows the three groups of 30 individuals.
Q: Men's Pre-Med 94 97 98 93 80 89 99 Ave=92.86 Var = 43.82 Men's Post-Med 90 91 89 88 81 80 92 Ave =…
A: The question is about hypo. testing Given : Randomly selected no. of women ( n1 ) = 6 Sample avg. of…
Q: ) What are the degrees of freedom for this test? B) What is the t-statistic for this test? C) What…
A:
Q: 10. An article in the Journal of Aircraft (Vol. 23, 1986, pp. 859-864) formulation that is capable…
A: Given, Sample Finite Element Cycle (x) Equivalent Plate Cycle(y) 1 14.58 14.76 2 48.52…
Q: Using chi sqaure goodness of fit test, test the hypothesis Ho: P1=50% P2= 40% P3 =10% . Test under…
A: Suppose p1 is proportion of 12 the graders, who consume less than 300 g vegetables, p2 is proportion…
Q: Dr. M wanted to estimate the mean cholesterol level for men living in Hartford. He took a sampled of…
A: Given,sample size(n)=20Mean(x¯)=86Standard deviation(s)=12
Q: Historically, the percentage of U.S. residents who support stricter gun control laws has been 55%. A…
A: Given X=1723 n=2500
Q: Complete the missing information for this regression model. Note: N=26N=26. (Except for P-values,…
A: From the given information, Y^=26.7592.382+0.818(0.547)X1-2.999(1.674)X2+1(0.734)X3
Q: Historically, the percentage of U.S. residents who support stricter gun control laws has been 55%. A…
A: standard error is given by SE=p^(1-p^)n
Q: 7) Define the following Type II Error Type I Error Power P-value
A: Objective of this question is that, defined the term Type 2 error Type 1 error Power P value
Q: Depression and insomnia often go hand-in-hand. Mendoza & Company, a national pharmaceutical firm,…
A: Given information: 17% use both antidepressants and sleeping pills regularly. 24% use only…
Q: Problem 5) Let Xhave the binomial PMF P₂(x)=(X)* a) Find the standard deviation of the random…
A: Note: According to Bartleby guidelines expert solve only one question and maximum three subpart of…
Q: Construct a levey Jennings chart for the following glucose control values as received from the…
A: Given information: Level 1: Mean=20 SD=1.25 Range for controls: ±1s=mean-s,…
Q: what is the degrees of freedoms within samples for this data?
A: Question 15: The data shows 30 individuals with three groups.
Q: Find the T-ratio. * Round to the hundredths place.
A: Here, there are two groups. that is, participants to eat breakfast another group without breakfast.…
Q: A normal distribution has a mean of 175 and a standard deviation of 38. What percent of observations…
A: Given that A Normal distribution has Mean (μ) = 175 Standard deviation (σ) = 38 We know that Z =…
Q: R3.35. Age and party 2008 The Pew Research Center collected data from national exits polls conducted…
A: The Pew research center collected data from national exit polls conducted by NBC news after the 2008…
Q: Given the scatter plot below, describe the following. Horsepower vs. MPG mpg 50- 40- 30- 20- 10- 0-…
A:
Q: Classify the following statement as an example of classical probability, empirical probability, or…
A:
Q: Coca-Cola is producing 2-Liter bottles of Coke, Sprite, and Fanta. During bottling, each bottles…
A: Given information- Population mean, µ = 2 liters Population standard deviation, σ = 4 milliliters =…
Q: 5) Find the Z-score for states with the following 2019 unemployment rates and explain their meaning:…
A: We have given that, 5) (a) 5.4% (b ) 3% We we will find the z - score? Note: According to…
Q: Please use the accompanying Excel data set or accompanying Text file data set when completing the…
A: The data shows the temperature and Porosity.
Q: average price of a college math textbook is $171 and the standard deviation is $27. Suppose that 48…
A: given data, μ=171σ=27n=48normal distribution
Q: Scenario 4 One sample has SS1=60 and a second sample has SS2=48. A) If n=10 for both…
A:
Q: Five males with an X-linked genetic disorder have one child each. The random variable x is the…
A: Mean(μ)=E(X)=∑X.P(X)E(X2)=∑X2.P(X)Variance(σ2)=E(X2)-(E(X))2Standard deviation(σ)=E(X2)-(E(X))2
Q: (a) A discrete random variable, X, has the following probability function P(x) 03 -2 -1 12 p(x) 0.3…
A: x P(x) -2 0.3 -1 0.2 1 0.2 2 0.3 we have to solve q-4.
Q: 48) The graph below represents family annual income in thousands of dollars. Approximate the mean…
A: According to the given information, we have The graph is given which represents family annual income…
Q: Suppose that the population of heights of all fully grown male West African giraffes is…
A: Followings are the explanation of the question Use the one sample t test and its confidence level…
Q: pressive strength x and intrinsic permeability y of various concrete mixes and cures. Summary…
A: Given Slope=-2.33 Intercept=48.014
Q: Sixty-five percent of men consider themselves knowledgeable soccer fans. If 10 men are randomly…
A: Given n=10, p=65%
Q: The manager at UPS feels that the weights of packages shipped recently are less than in he past.…
A: Given Population mean μ=36.7, standard deviations σ=14.2, level of significance=0.01, n=64, sample…
Q: Which value represents the variability attributable to the different factor levels or treatments?
A: From the One-Way ANOVA, the variability attributes to the different factor levels or Treatment is…
Q: Problem C: Suppose that a sample of 200 respondents were asked about their preference on vacation…
A: Given The data is as follows: Beaches Mountains Men 207 282 Women 231 242
Q: The table below lists weights (carats) and prices (dollars) of randomly selected diamonds. Find the…
A:
Q: 11) Consider each of the following scenarios and state whether the variable in question is a…
A: Note: Hi, there! since multiple questions are posted, we are allowed to solve first three subparts.…
Q: According to the norms established for a reading comprehension test, eighth graders should average…
A: From the provided information, Population standard deviation (σ) = 8.6 Sample mean (x̄) = 87.8…
Q: A newspaper article reported that people spend a mean of 7 hours per day watching TV, with a…
A: given data, normal distributionμ=7σ=2.1 top 10% of the population spent most timefor watching tv
Q: 23.9 4.4 22.2 6.9 75.1 13.8 69.7 21.7 4.0 12.6 7.5 ence 23.6 he icon to view the critical values of…
A: Given X=1.2 Enter the given value into Excel sheet
Q: An online marketplace retailer performed a study that compared the average domestic shipping time of…
A: The given sample correlation coefficient is -0.161.
Q: A biologist estimate that 70% of the deer carry a type of tick. For a sample of 300 deer random,…
A: Given P=70% n=300
Q: If n = 15, ¯xx¯ = 42, and s = 18, construct a confidence interval at a 80% confidence level. Assume…
A:
Q: Suppose that( 0.743,0.857) is an approximate 99.56% confidence interval for an unknown population…
A: We have given the confidence interval CI = ( 0.743 , 0.857) for an unknown population proportion…
Q: 4) Find a 90% confidence interval for the Women's Population Pre-med mean. Find a 90% confidence…
A: (a) The objective is to find a 90% confidence interval for the Women's Population Pre-med mean.…
Q: A service station owner believes that equal numbers of customers prefer to buy gasoline on every day…
A: It is needed to test the whether the number of customers who prefers to buy gasoline on each day of…
Q: Question 2
A: 2. Given Sample size, n=12 α=0.05 The data is as follows: 104.3, 89.6, 89.9, 95.6, 95.2, 90.0, 98.8,…
Q: elephone Calls A researcher knew that before cell phones, a ade on average 2.5 calls per day. He…
A: Given Xbar=2.6 Standard deviation=0.6 n=34
Q: Suppose that an estimated regression model is given by y^ = 0.3x + 5. Which statement is FALSE? The…
A: Given information- We have given an estimated regression model- y^=0.3x+5 Comparing the above…
Step by step
Solved in 3 steps with 9 images
- The following tabe has data for mexico between the years 1993-2007, the year 1994 was intentionally ommitted.using the data, please assisst with the following:Using R-Studio, estimate a regression equation to determine the effect of unemployment, general level, wages and life expectancy at birth for both sexes on the net migration rate. (All codes and regression output should be provided a screenshot will suffice) i) Write the regression equation and interpret the coefficientsii)Interpret the coefficient of determinationiii) Using the 10% level of significance, determine and interpret if the overall regression equation is statistically significant. In responding, construct and test any appropriate hypothesisiv)Determine and interpret the confidence interval for the independent variable(s) Year Net Migration Rate Total Fertility unemployment General Level Wages Life Expectancy at Birth 2007 -2.855 2.4212 1505.196 4716 74.2384 2006 -2.917 2.456 1377.701 4426 74.3313 2005 -3.012…The manager of a commuter rail transportation system was recently asked by her governing board to determine which factors have a significant impact on the demand for rides in the large city served by the transportation network. The system manager collected data on variables thought to be possibly related to the number of weekly riders on the city's rail system. The file P10_20.xlsx contains these data. Estimate a multiple regression equation using the given data. Interpret each of the estimated regression coefficients. Enter your answers in thousands. For example, an answer of 1.234 thousand should be entered as 1.234, not 1,234. Round your answers to three decimal places, if necessary. Holding all else constant, ridership by approximately thousands when the price per ride rises by $1.00. Holding all else constant, ridership by approximately thousands when the population increases by 1,000. Holding all else constant, ridership by approximately thousands when the disposable per capita…Marina, Elena, Paloma, Alejandra and Rocío are 2, 3, 5, 7 and 8 years old and weigh 14, 20, 30, 42 and 44 kg respectively. With these data:(a) Find the equation of the regression line of age on weight.b) Estimate the approximate "weight" for a 6-year-old girl.
- The Wall Street Journal asked Concur Technologies, Inc., an expense management company, to examine data from million expense reports to provide insights regarding business travel expenses. Their analysis of the data showed that New York was the most expensive city. The following table shows the average daily hotel room rate () and the average amount spent on entertainment () for a random sample of of the most-visited U.S. cities. These data lead to the estimated regression equation . For these data . Click on the datafile logo to reference the data. Use Table 1 of Appendix B. City Room Rate($) Entertainment($) Boston 148 161 Denver 96 105 Nashville 91 101 New Orleans 110 142 Phoenix 90 100 San Diego 102 120 San Francisco 136 167 San Jose 90 140 Tampa 82 98 a. Predict the amount spent on entertainment for a particular city that has a daily room rate of (to decimals). b. Develop a confidence interval for the mean amount spent on entertainment for all…The Wall Street Journal asked Concur Technologies, Inc., an expense management company, to examine data from million expense reports to provide insights regarding business travel expenses. Their analysis of the data showed that New York was the most expensive city. The following table shows the average daily hotel room rate () and the average amount spent on entertainment () for a random sample of of the most-visited U.S. cities. These data lead to the estimated regression equation . For these data . Click on the datafile logo to reference the data. Use Table 1 of Appendix B. full question attached in ss thanks for help aprpeicated aigjrowoirjA car dealer wants to estimate the price of a used car based on the age of the car and the mileage. Based on a sample of 20 cars, she determines the sample regression equation that predicts price taxes on the basis of the age (in years) of the number of miles is Price=21,510-1230Age-0.035 Miles (a) If the age of the car was fixed and the mileage was increased by 10,000, would the price increase or decrease and by how much? (b) Predict the selling price of a five-year-old car with 65,000 miles. (Round your answers to the nearest whole number.)
- For ease of performing the next task, move the variable "Social Networks - Facebook, Twitter, etc" to column A on the spreadsheet. (i.e. Make sure it is the first column in the spreadsheet.) The hiring managers recognize that the funding for one employment source depends on the funding for the other sources. Therefore, they want you to perform a multiple regression predicting Social Network funding from Months 1-12, while controlling for the funding of Billboard, Careerbuilder, Company Intranet - Partner, and Diversity Job Fair. Assume that we know the funding for the the controlled variables for Month 13. They are: Billboard: 520 Careerbuilder: 800 Company Intranet: 0 Diversity Job Fair: 1000 For this model and these known values, what is the predicted value for Social Network funding for Month 13?A medical researcher wants to determine how a new medication affects blood pressure. An amount of medication of 145 mg is found to result in a blood pressure of 128.42 mm Hg. What is the predicted blood pressure? Where is the observed value in relation to the regression line? The equation of the regression line is �^=140+(−0.0667)�. Where is the observed value in relation to the regression line? An amount of medication of 178 mg is found to result in a blood pressure of 128.13 mm Hg. What is the predicted blood pressure? Where is the observed value in relation to the regression line? An amount of medication of 200 mg is found to result in a blood pressure of 129.15 mm Hg. What is the predicted blood pressure? The options for the drop down boxes are below, above or on the regression line.The table below gives the age and bone density for five randomly selected women. Using this data, consider the equation of the regression line, yˆ=b0+b1xy^=b0+b1x, for predicting a woman's bone density based on her age. Keep in mind, the correlation coefficient may or may not be statistically significant for the data given. Remember, in practice, it would not be appropriate to use the regression line to make a prediction if the correlation coefficient is not statistically significant. Age Bone Density37 34341 33058 31861 31467 312 Step 6 of 6 : Find the value of the coefficient of determination. Round your answer to three decimal places.
- A business statistics professor would like to develop a regression model to predict the final exam scores for students based on their current GPAs, the number of hours they studied for the exam, the number of times they were absent during the semester, and their genders. The data for these variables are given in the accompanying table at the bottom of this page. a) Using Excel, construct a regression model using all of the independent variables. Create the dummy variable Gen, which equals 1 for a male and 0 for a female student ( this assignment is arbitrary) complete the regression equation for the model below, where y= Score, x1= GPA, x2= Hours, x3= Absenses, and x4= Gen. y= (__) + (__)x1 + (__)x2 + (__)x3 + (__)x4 b) Test the significance of the overall regression model using a= 0.10. c) interpret the meaning of the regression coefficient for the dummy variable. d) using the p-values, identify which independent variables are significant with a= 0.10. e) construct a regression…The table below gives the age and bone density for five randomly selected women. Using this data, consider the equation of the regression line, yˆ=b0+b^1x, for predicting a woman's bone density based on her age. Keep in mind, the correlation coefficient may or may not be statistically significant for the data given. Remember, in practice, it would not be appropriate to use the regression line to make a prediction if the correlation coefficient is not statistically significant. Age Bone Density34 35745 34148 33160 32965 325 Step 1 of 6: Find the estimated slope. Round your answer to three decimal places.*The table below gives the age and bone density for five randomly selected women. Using this data, consider the equation of the regression line, yˆ=b0+b1xy^=b0+b1x, for predicting a woman's bone density based on her age. Keep in mind, the correlation coefficient may or may not be statistically significant for the data given. Remember, in practice, it would not be appropriate to use the regression line to make a prediction if the correlation coefficient is not statistically significant. *Age Bone Density33 35243 33259 32464 32265 314