Suppose the monthly charges for cell phone plans are normally distributed with mean μ = $61 and standard deviation = $18. (a) Draw a normal curve with the parameters labeled (b) Shade the region that represents the proportion of plans that charge less than $43 (c) Suppose the area under the normal curve to the left of X= $43 is 0.1587 Provide an interpretation of this result. O A. Q (b) Choose the correct graph below O A. N N 61 79 97 43 61 79 43 1 25 61 97 О в. Q Q OB. a 43 61 79 O C. O C. N s 25 43 61 25 61 97 43 61 79 97 Q na (c) Select the correct choice below and fill in the answer box to complete your choice. (Type a whole number) OA. The probability is 0.1587 that a randomly selected cell phone plan in this population is less than $ per month OB. The probability is 0 1587 that a randomly selected cell phone plan in this population is more than $ OD. per month. O D. 25 43 61 Q Q
Suppose the monthly charges for cell phone plans are normally distributed with mean μ = $61 and standard deviation = $18. (a) Draw a normal curve with the parameters labeled (b) Shade the region that represents the proportion of plans that charge less than $43 (c) Suppose the area under the normal curve to the left of X= $43 is 0.1587 Provide an interpretation of this result. O A. Q (b) Choose the correct graph below O A. N N 61 79 97 43 61 79 43 1 25 61 97 О в. Q Q OB. a 43 61 79 O C. O C. N s 25 43 61 25 61 97 43 61 79 97 Q na (c) Select the correct choice below and fill in the answer box to complete your choice. (Type a whole number) OA. The probability is 0.1587 that a randomly selected cell phone plan in this population is less than $ per month OB. The probability is 0 1587 that a randomly selected cell phone plan in this population is more than $ OD. per month. O D. 25 43 61 Q Q

Glencoe Algebra 1, Student Edition, 9780079039897, 0079039898, 2018
18th Edition
ISBN:9780079039897
Author:Carter
Publisher:Carter
Chapter10: Statistics
Section10.6: Summarizing Categorical Data
Problem 31PPS

Related questions
Question
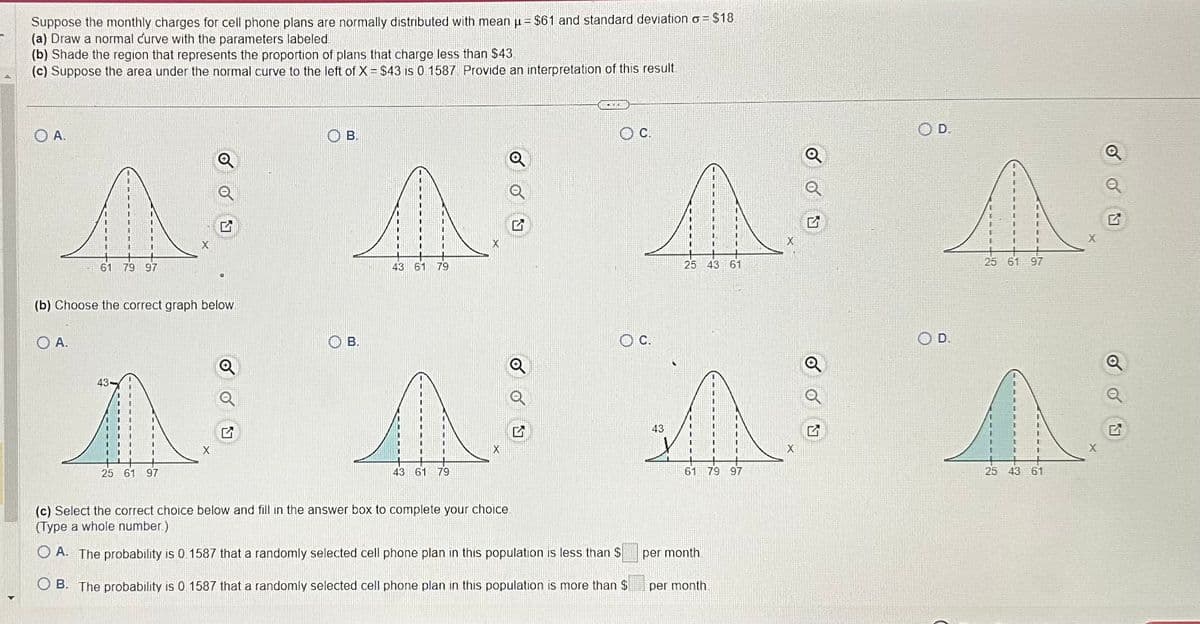
Transcribed Image Text:Suppose the monthly charges for cell phone plans are normally distributed with mean u = $61 and standard deviation o= $18.
(a) Draw a normal curve with the parameters labeled
(b) Shade the region that represents the proportion of plans that charge less than $43
(c) Suppose the area under the normal curve to the left of X= $43 is 0.1587 Provide an interpretation of this result
OA.
(b) Choose the correct graph below
B.
A.
N NAA
61
79 97
25 43 61
B.
OC.
43 61 79
OC.
(c) Select the correct choice below and fill in the answer box to complete your choice
(Type a whole number)
OA. The probability is 0.1587 that a randomly selected cell phone plan in this population is less than $
OB. The probability is 0.1587 that a randomly selected cell phone plan in this population is more than $
43
N N NA
25 61
43 61
61 79 97
D.
per month
per month.
OD.
25 61 97
Q
43 61
Q
Expert Solution
This question has been solved!
Explore an expertly crafted, step-by-step solution for a thorough understanding of key concepts.

Step by step
Solved in 5 steps with 8 images

Recommended textbooks for you
Glencoe Algebra 1, Student Edition, 9780079039897…
Algebra
ISBN:
9780079039897
Author:
Carter
Publisher:
McGraw Hill
Glencoe Algebra 1, Student Edition, 9780079039897…
Algebra
ISBN:
9780079039897
Author:
Carter
Publisher:
McGraw Hill