Suppose the quantity supplied falls, relative to the values given in the table above, by 20 million pounds per month at prices above $5; at a price of $5 or less per pound, the quantity supplied becomes zero. Draw the new supply curve and show the new equilibrium price and quantity.
Suppose the quantity supplied falls, relative to the values given in the table above, by 20 million pounds per month at prices above $5; at a price of $5 or less per pound, the quantity supplied becomes zero. Draw the new supply curve and show the new equilibrium price and quantity.

Chapter5: Elasticity Of Demand And Supply
Section: Chapter Questions
Problem 1.1P: (Calculating Price Elasticity of Demand) Suppose that 50 units of a good are demanded at a price of...

Related questions

Question
Suppose the quantity supplied falls, relative to the values given in the table above, by 20 million pounds per month at prices above $5; at a price of $5 or less per pound, the quantity supplied becomes zero. Draw the new supply curve and show the new
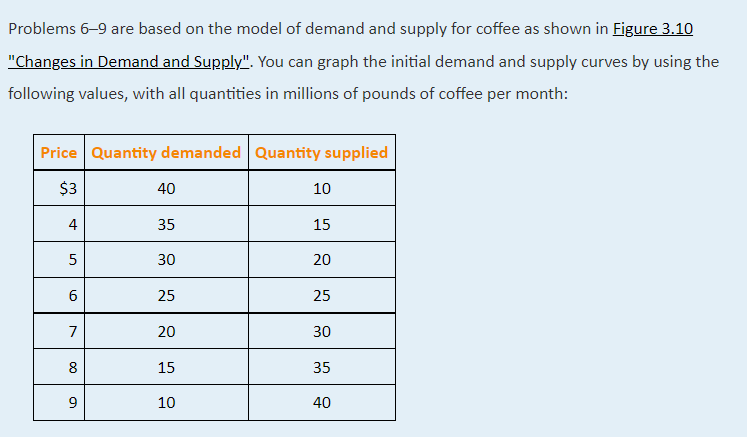
Transcribed Image Text:Problems 6-9 are based on the model of demand and supply for coffee as shown in Figure 3.10
"Changes in Demand and Supply". You can graph the initial demand and supply curves by using the
following values, with all quantities in millions of pounds of coffee per month:
Price Quantity demanded Quantity supplied
$3
4
5
6
7
8
9
40
35
30
25
20
15
10
10
15
20
25
30
35
40
Expert Solution
This question has been solved!
Explore an expertly crafted, step-by-step solution for a thorough understanding of key concepts.

Step by step
Solved in 2 steps with 2 images

Knowledge Booster


Learn more about
Need a deep-dive on the concept behind this application? Look no further. Learn more about this topic, economics and related others by exploring similar questions and additional content below.Recommended textbooks for you


Economics (MindTap Course List)
Economics
ISBN:
9781337617383
Author:
Roger A. Arnold
Publisher:
Cengage Learning
Economics (MindTap Course List)
Economics
ISBN:
9781337617383
Author:
Roger A. Arnold
Publisher:
Cengage Learning


Microeconomics: Principles & Policy
Economics
ISBN:
9781337794992
Author:
William J. Baumol, Alan S. Blinder, John L. Solow
Publisher:
Cengage Learning

Principles of Economics 2e
Economics
ISBN:
9781947172364
Author:
Steven A. Greenlaw; David Shapiro
Publisher:
OpenStax