Suppose the same masses are used for a force table experiment as were used in Part 1, but each pulley is moved 1800 so that the 0.100 kg mass acts at 2000, and the 0.200 kg mass acts at 2700. What is the magnitude of the resultant in this case? How does it compare to the resultant in Part 1? SEE IMAGES FOR DETAILS
Suppose the same masses are used for a force table experiment as were used in Part 1, but each pulley is moved 1800 so that the 0.100 kg mass acts at 2000, and the 0.200 kg mass acts at 2700. What is the magnitude of the resultant in this case? How does it compare to the resultant in Part 1? SEE IMAGES FOR DETAILS

University Physics Volume 1
18th Edition
ISBN:9781938168277
Author:William Moebs, Samuel J. Ling, Jeff Sanny
Publisher:William Moebs, Samuel J. Ling, Jeff Sanny
Chapter2: Vectors
Section: Chapter Questions
Problem 60P: A barge is pulled by the two tugboats shown in the following figure. One tugboat pulls on the barge...

Related questions

Topic Video
Question
Suppose the same masses are used for a force table experiment as were used in Part 1, but each pulley is moved 1800 so that the 0.100 kg mass acts at 2000, and the 0.200 kg mass acts at 2700. What is the magnitude of the resultant in this case? How does it compare to the resultant in Part 1?
SEE IMAGES FOR DETAILS
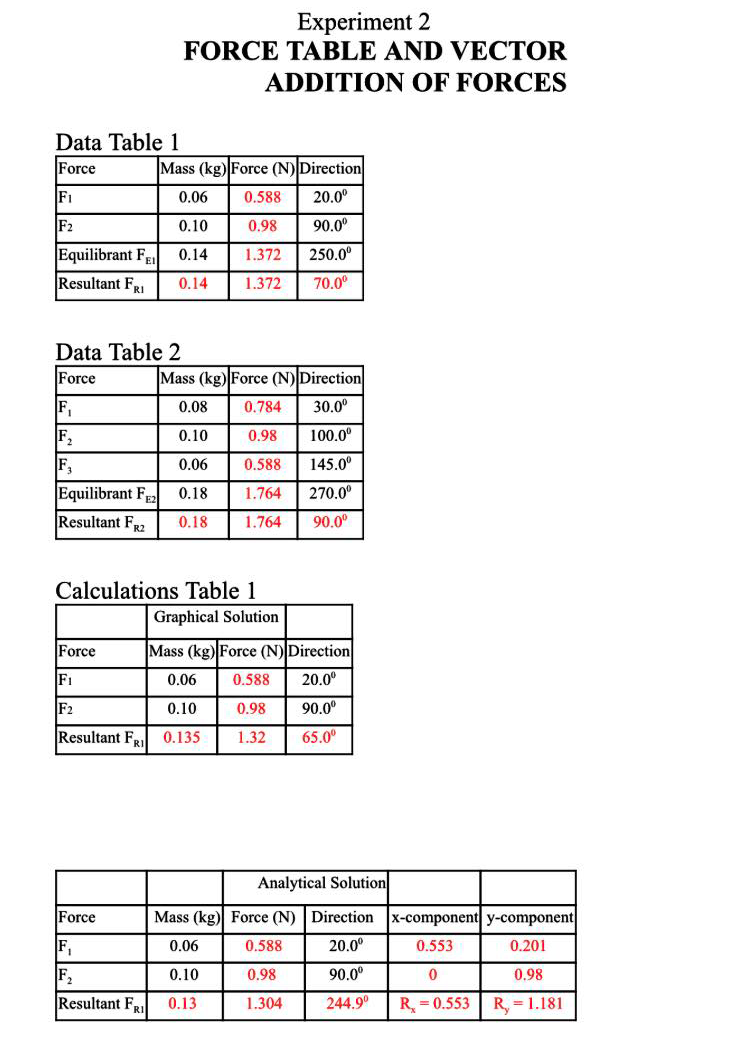
Transcribed Image Text:Experiment 2
FORCE TABLE AND VECTOR
ADDITION OF FORCES
Data Table 1
Force
Mass (kg) Force (N) Direction
F1
0.06
0,588
20.0°
F2
0.10
0.98
90.00
Equilibrant FE
1.372
250.0°
0.14
Resultant FRI
0.14
1.372
70.0°
Data Table 2
Force
Mass (kg) Force (N) Direction
F,
0.08
0.784
30.0°
0.10
0.98
100.00
F,
0.06
0.588
145.0°
Equilibrant Fp
0.18
1.764
270.0°
Resultant FR2
0.18
1.764
90.0°
Calculations Table 1
Graphical Solution
Force
Mass (kg) Force (N) Direction
0.06
0.588
20.0°
F2
0.10
0.98
90.0°
Resultant FRI
0.135
1.32
65.0°
Analytical Solution
Force
Mass (kg) Force (N) Direction x-component y-component
F,
0.06
0.588
20.0°
0.553
0.201
F.
0.10
0.98
90.0°
0.98
Resultant F
0.13
1.304
244.9°
R = 0.553
R = 1.181
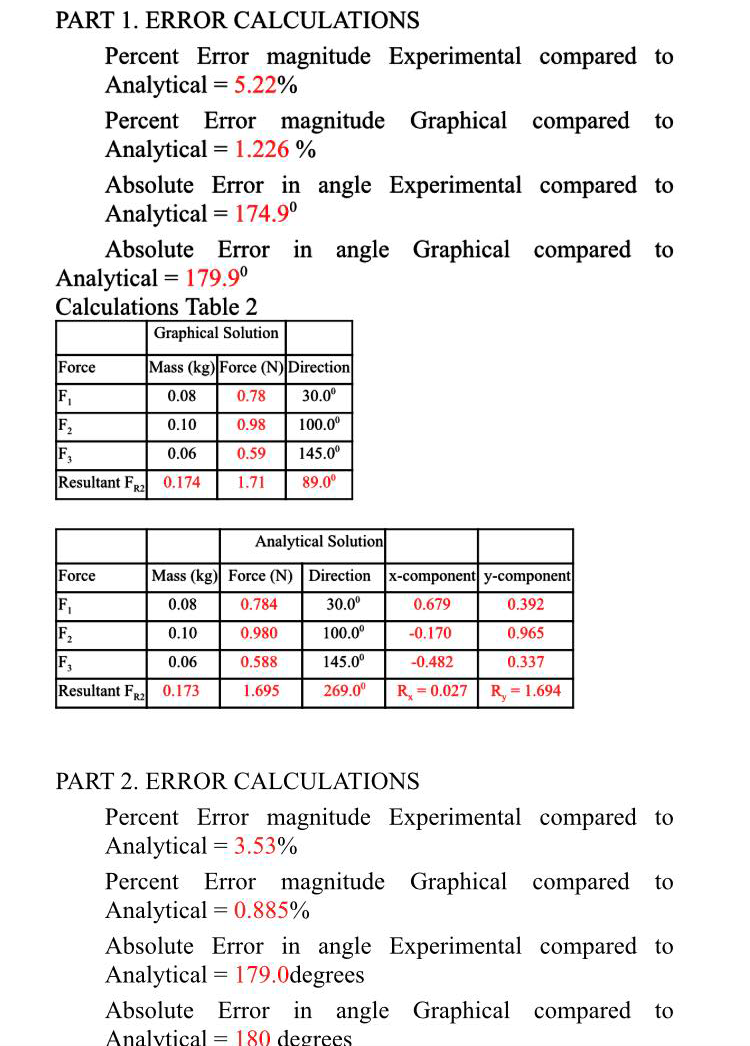
Transcribed Image Text:PART 1. ERROR CALCULATIONS
Percent Error magnitude Experimental compared to
Analytical
Percent Error magnitude Graphical compared to
Analytical = 1.226 %
Absolute Error in angle Experimental compared to
Analytical
Absolute Error in angle Graphical compared to
Analytical = 179.9°
Calculations Table 2
= 5.22%
= 174.9°
Graphical Solution
Force
Mass (kg) Force (N) Direction
F,
0.08
0.78
30.0°
100.0°
F2
F,
0.10
0.98
0.06
0.59
145.0°
Resultant F,
0.174
1.71
89.0°
Analytical Solution
Force
Mass (kg) Force (N) |Direction x-component y-component
F,
0.08
0.784
30.0°
0.679
0.392
F2
F,
0.10
0.980
100.0°
-0.170
0.965
0.06
0.588
145.00°
-0.482
0.337
Resultant F 0.173
269.0°
R, = 1.694
1.695
R = 0.027
PART 2. ERROR CALCULATIONS
Percent Error magnitude Experimental compared to
Analytical = 3.53%
Percent Error magnitude Graphical compared to
Analytical = 0.885%
Absolute Error in angle Experimental compared to
Analytical = 179.0degrees
Absolute Error in angle Graphical compared to
Analytical = 180 degrees
Expert Solution
This question has been solved!
Explore an expertly crafted, step-by-step solution for a thorough understanding of key concepts.

This is a popular solution!

Trending now
This is a popular solution!

Step by step
Solved in 2 steps with 1 images

Knowledge Booster


Learn more about
Need a deep-dive on the concept behind this application? Look no further. Learn more about this topic, physics and related others by exploring similar questions and additional content below.Recommended textbooks for you
University Physics Volume 1
Physics
ISBN:
9781938168277
Author:
William Moebs, Samuel J. Ling, Jeff Sanny
Publisher:
OpenStax - Rice University

An Introduction to Physical Science
Physics
ISBN:
9781305079137
Author:
James Shipman, Jerry D. Wilson, Charles A. Higgins, Omar Torres
Publisher:
Cengage Learning

College Physics
Physics
ISBN:
9781285737027
Author:
Raymond A. Serway, Chris Vuille
Publisher:
Cengage Learning
University Physics Volume 1
Physics
ISBN:
9781938168277
Author:
William Moebs, Samuel J. Ling, Jeff Sanny
Publisher:
OpenStax - Rice University
An Introduction to Physical Science
Physics
ISBN:
9781305079137
Author:
James Shipman, Jerry D. Wilson, Charles A. Higgins, Omar Torres
Publisher:
Cengage Learning
College Physics
Physics
ISBN:
9781285737027
Author:
Raymond A. Serway, Chris Vuille
Publisher:
Cengage Learning

Physics for Scientists and Engineers with Modern …
Physics
ISBN:
9781337553292
Author:
Raymond A. Serway, John W. Jewett
Publisher:
Cengage Learning

Physics for Scientists and Engineers
Physics
ISBN:
9781337553278
Author:
Raymond A. Serway, John W. Jewett
Publisher:
Cengage Learning

College Physics
Physics
ISBN:
9781938168000
Author:
Paul Peter Urone, Roger Hinrichs
Publisher:
OpenStax College