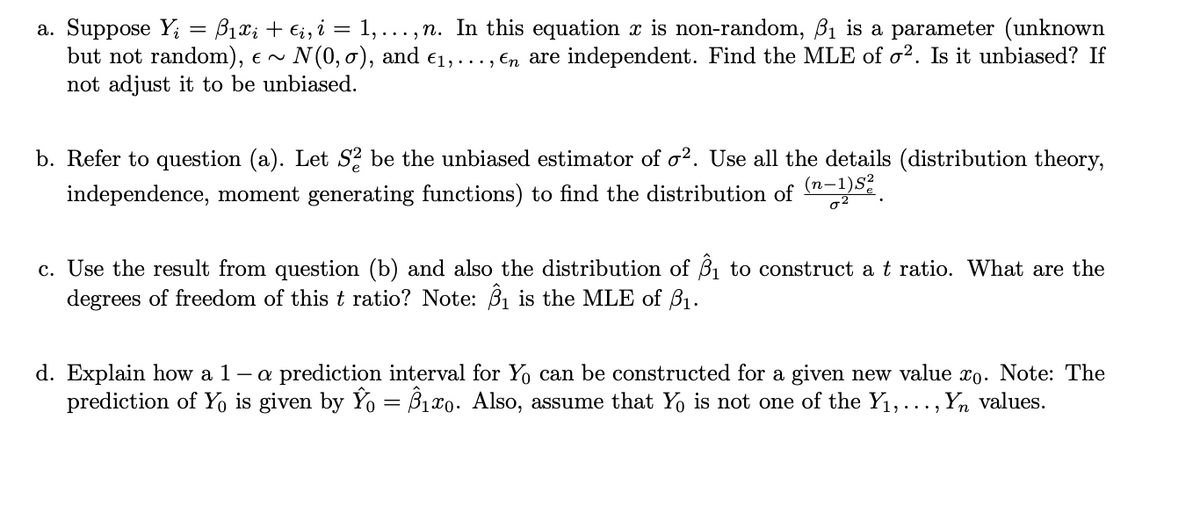
Suppose Y; = B1x; + €;, i = 1, ...,n. In this equation x is non-random, ß1 is a parameter (unknown but not random), e ~ N(0, 0), and €1,..., En are independent. Find the MLE of o². Is it unbiased? If not adjust it to be unbiased.


Q: Let X1,...,X, be a random sample from (1+ 0x) f(x) = 2 ,-1< x < 1, -1 < 0 < 1. Find the consistent…
A: The random sample consists of X1,X2,...,Xn. Need to obtain: The consistent estimator of θ. The…
Q: For 50 randomly selected speed dates, attractiveness ratings by males of their female date partners…
A: Let the independent variable X denote the attractiveness ratings by males of their female data…
Q: 2.4. Let Y,, Y2, ., Yn denote a random sample from a uniform distribution with a pdf given by fyl®)…
A:
Q: An urban community wants to show that the incidence of breast cancer is higher in their locality…
A: Hi! Thank you for the question, As per the honor code, we are allowed to answer three sub-parts at a…
Q: Let X1, X2, .. ,Xn be a random sample from normal population with mean µ and variance o?. What is…
A: Given that. Xi fillows normal distribution with mean (u) and variance ( sigma square). Find M. L.…
Q: T. Deetlermine thie test stathstic, p-value, Bresult of Thiis hypothesis 2
A: 1. The pooled proportion is, p¯=x1+x2n1+n2=116+135258+311=251569=0.4411 The pooled proportion is…
Q: For 50 randomly selected speed dates, attractiveness ratings by males of their female date…
A: Given, The 50 paired ratings yield x=6.3, y=6.0, r=−0.264, P-value=0.063, and y=7.92−0.304x.
Q: For 50 randomly selected speed dates, attractiveness ratings by males of their female date…
A:
Q: For 50 randomly selected speed dates, attractiveness ratings by males of their female date…
A: Decision Rule : Reject H0 if P-value < ? . Here P-value = 0.326 > 0.10. Conclusion : By…
Q: If y,, y2,y, be a random sample taken from a normal distribution with parameters u and o, then the…
A: we wants to find the log likelihood function of normal distribution of y1,y2,.....,ym random sample…
Q: Assume that as a portfolio manager the beta of your portfolio is 1.15 and that your performance is…
A: Given, Beta = β = 1.151) RFR = 0.0625 = 6.25% Rm(proxy) = 0.12 = 12%2) Rk = 0.078 = 7.8%…
Q: For 50 randomly selected speed dates, attractiveness ratings by males of their female date partners…
A: Given, The linear regression line is, The objective is to find the best predicted value of y^…
Q: If Uj and U2 each have a normal distribution with mean 0 and variance 202. Furthermore, my, (t) =…
A:
Q: For 50 randomly selected speed dates, attractiveness ratings by males of their female date partners…
A:
Q: Let Y,, Y2, ., Yn denote a random sample from a power family distribution with parameter 0. (@yº-1…
A: P.d.f is given by, f(y/θ)= θyθ-1/3θ , 0<=y<=3 E(y)= ∫03yfy|θdy = ∫03 (θ/3θ)yθ dy =…
Q: For 50 randomly selected speed dates, attractiveness ratings by males of their female date…
A: Decision Rule for hypothesis testing : During a statistical test, the p- value helps us determine…
Q: Consider a random sample X1, X2,...., X, from a distribution where the parameter 0 is unknown and…
A: given:jx|θ1n = 1θe-x-nθ
Q: Let {e,, e, ***, e,} be a random sample of e. e- N(0, o'), where o >0. Let Y,-a+ e,, for i-1,nand…
A: Given that, e1,e2,...,en~N(0,σ2)Where, σ2>0Yi=α+ei ; i=1:n
Q: For 50 randomly selected speed dates, attractiveness ratings by males of their female date…
A: Decision Rule for hypothesis testing : During a statistical test, the p- value helps us determine…
Q: If X. Y and Z are uncorrelated RVs with zero means and standard deviations 5 12 and 9 respectively…
A: Given X,Y and Z are uncorrelated, which mean cov(X,Y)=Cov(Y,Z)=Cov(X,Z)=0 E(X)=E(Y)=E(Z)=0…
Q: I. If X1, X2, ...,Xn constitute a random sample from a population with the mean µ, what condition…
A: An estimator c is said to be unbiased estimator of µ is E(c) = µ.
Q: Let Y₁, Y2,..., Yn denote a random sample of size n from a population with a uniform distribution on…
A:
Q: For 50 randomly selected speed dates, attractiveness ratings by males of their female date partners…
A: Solution
Q: 5.7.2 Let Y1, Y2,..., Yn be a random sample of size n from a normal pdf having µ = 0. Show that S…
A:
Q: If the random variables X and Y are orthogonal, then their correlation is zero. Rxy =0
A:
Q: Let Yı, Y2,, Ya be a random sample from the following distribution fG) = {02 for 0sy 202 elsewhere…
A: We want to find the sufficient statistic
Q: For 50 randomly selected speed dates, attractiveness ratings by males of their female date partners…
A:
Q: For 50 randomly selected speed dates, attractiveness ratings by males of their female date partners…
A:
Q: For 50 randomly selected speed dates, attractiveness ratings by males of their female date partners…
A: Given, The regression equation is, The objective is to find the best predicted value of y^…
Q: For 50 randomly selected speed dates, attractiveness ratings by males of their female date partners…
A: Introduction: The estimated regression equation for predicting the attractiveness ratings of females…
Q: A water quality parameter monitored in a lake is normally dist. With u=24.3. It is also known that…
A: Let X be the random variable from normal distribution with mean (μ) = 24.6, and X = 17.6 Then, We…
Q: Find the critical value, z0, from the z table for the given parameters. a=0.20 two tailed test
A:
Q: Compute E(y6) for the following model, where e ~ wn(0,0.01), i.e., a white noise process with mean…
A:
Q: If a random variable X has pdf ?(?) = 3/376x(1−?), 0 < ?< 1 and
A: Given pdf of X is, f(x)=3376x(1-x), 0<x<1 Given y=x+1y2=x+1y2-1=x2y=dxdy Limits for Y: If…
Q: Suppose that z,., Zn are fixed constants and that for i = 1,..,n, X, is normally distributed with…
A: “Since you have posted a question with multiple subparts, we will solve the main question for you.…
Q: Let Y1, Y2, ..., Yn be a random sample from a Gamma distribution with parameters a = 1 and B = 0 >…
A: Y1, Y2, Y3,...........,Yn be a random variable between α, β. The degree of freedom is 2n
Q: X1, ..., Xn be a sample from an Poisson population with parameter λ. (a) Find the maximum likelihood…
A: The probability distribution of Poisson distribution is given by: The maximum likelihood estimator…
Q: For 50 randomly selected speed dates, attractiveness ratings by males of their female date…
A: From the given information, y=7.31−0.198x
Q: Prove that for a random sample of size n, X, X2 X, taken from a finite population s - (, - i) Σ n…
A:
Q: For 50 randomly selected speed dates, attractiveness ratings by males of their female date partners…
A: Given Information : For 50 randomly selected speed dates , attractiveness ratings by males o their…
Q: The following are data on the ages and incornes of a random sample of 5 executives working for XYZ…
A: Solution-: We find, (a) Multiple regression model (b) Predict X1=35,X2=1.25
Q: From the parameter estimation output, which of the following is FALSE?
A: Hello! As you have posted 2 different questions, we are answering the first question. In case you…
Q: 10. Let X1,..., X„ be an iid sample from f(x | 0) = 0x°-1, positive. Find the MLE and MOM estimators…
A: Computing mle of Ѳ:The mle estimate of a parameter is that value of the parameter which maximizes…
Q: Let x1, x2, ...,X, be a random sample from N(u, o?), and let 0 = (6x1 - 2x2) -(4x3-3x4) %3D | 4 be…
A:
Q: Suppose that you observe a random sample (z., )}N, from the model where e, independent of z. Ee, =…
A: Suppose (x1,y1),(x2,y2),...(xN, yN) be a random sample from the model yi=βxi+ui and ui=h(xi)∈i Where…
Q: For 50 randomly selected speed dates, attractiveness ratings by males of their female date partners…
A: Introduction: The estimated least squares regression equation to predict the attractiveness rating…
Q: For 50 randomly selected speed dates, attractiveness ratings by males of their female date partners…
A:
Q: Consider a random sample of size n drawn from a population with mean Hx and variance o. Show that:…
A:
Q: Suppose that for a stochastic variable X~B(n;p) with the parameters n = 10 and p = 30% a) BY HAND…
A: Given that X follows binomial distribution with parameters n=10 and p=0.3 a) We know that for a…
Q: If pdf of a random variable is given by fx(x) = e* for x20 find M, (v), m, and m,.
A:

Step by step
Solved in 3 steps

- If X1, X2, ... , Xn constitute a random sample of size nfrom a geometric population, show that Y = X1 + X2 +···+ Xn is a sufficient estimator of the parameter θ.suppose that the proportions of blood phenotypes in a particular population are as follows a=0.40 b=0.12 ab=0.04 o=0.44 assume the phenotype of three randomly selected individuals are independent of one another. what is the probabililty that the phenotypes of three randomly selected individuals match?Consider the following population model for household consumption: cons = a + b1 * inc+ b2 * educ+ b3 * hhsize + u where cons is consumption, inc is income, educ is the education level of household head, hhsize is the size of a household. Suppose that the variable for consumption is measured with error, so conss = cons + e, where conss is the mismeaured variable, cons is the true variable, e is random, i.e., e is independent of all the regressors. What would we expect and why? A) OLS estimators for the coefficients will all be biased B) OLS estimators for the coefficients will all be unbiased C) ALL the standard errors will be bigger than they would be without the measurement error D) both B and C
- If X1, X2, ... , Xn constitute a random sample of size n from an exponential population, show that X is a consis-tent estimator of the parameter θ.A paper investigated the driving behavior of teenagers by observing their vehicles as they left a high school parking lot and then again at a site approximately 1 2 mile from the school. Assume that it is reasonable to regard the teen drivers in this study as representative of the population of teen drivers. Amount by Which Speed Limit Was Exceeded MaleDriver FemaleDriver 1.2 -0.1 1.4 0.4 0.9 1.1 2.1 0.7 0.7 1.1 1.3 1.2 3 0.1 1.3 0.9 0.6 0.5 2.1 0.5 (a) Use a .01 level of significance for any hypothesis tests. Data consistent with summary quantities appearing in the paper are given in the table. The measurements represent the difference between the observed vehicle speed and the posted speed limit (in miles per hour) for a sample of male teenage drivers and a sample of female teenage drivers. (Use μmales − μfemales.Round your test statistic to two decimal places. Round your degrees of freedom down to the nearest whole number. Round your p-value to…If the value of Cronbach’s alpha is 0.07, it means ___________; a. Research instrument is not reliable b. Research instrument is internally consistent c. Data is reliable d. Data is internally consistent
- A paper investigated the driving behavior of teenagers by observing their vehicles as they left a high school parking lot and then again at a site approximately 1 2 mile from the school. Assume that it is reasonable to regard the teen drivers in this study as representative of the population of teen drivers. Amount by Which Speed Limit Was Exceeded MaleDriver FemaleDriver 1.3 -0.1 1.3 0.4 0.9 1.1 2.1 0.7 0.7 1.1 1.3 1.2 3 0.1 1.3 0.9 0.6 0.5 2.1 0.5 (a) Use a .01 level of significance for any hypothesis tests. Data consistent with summary quantities appearing in the paper are given in the table. The measurements represent the difference between the observed vehicle speed and the posted speed limit (in miles per hour) for a sample of male teenage drivers and a sample of female teenage drivers. (Use μmales − μfemales.Round your test statistic to two decimal places. Round your degrees of freedom down to the nearest whole number. Round your p-value to…2- An expert estimates that the distribution parameter for durability times of parts produced with machine A in the factory is different from the distribution parameter for durability times of parts produced with machine B. Durability times of 4 parts produced from machine A and 4 parts produced from machine B are given below. Find the Mann-Whitney U value by using these data. a) 18 B) 6 NS) 16 D) 20 TO) 12Assume that as a portfolio manager the beta of your portfolio is 1.15 and that your performance is exactly on target with the SML data under condition 1. If the true SML data is given by condition 2, how much does your performance differ from the true SML? (1) RFR = 0.0625 Rm(proxy) = 0.12 (2) RK = 0.078 Rm(true) = 0.10
- A dietitian wishes to see if a person’s cholesterol level will be changed if the diet is supplemented by a certain mineral. Four subjects were pre-tested, and they took the mineral supplement for a 6-week period. The results are shown in the table. Is there sufficient evidence to conclude that the population mean of cholesterol levels has been changed after six weeks at α=0.2α=0.2? Assume that the differences are from an approximately normally distributed population. Subject Cholestrol Level (mg/dl) Cholestrol Level after 6 Weeks (mg/dl) dd ¯dd¯ (d−¯d)2(d-d¯)2 1 206 217 11 2 219 184 -35 3 202 204 2 4 213 205 -8 Total -30 a) Calculate the mean, the sum of the squared deviation from the mean, and the standard deviation of differences. Do not include the unit for each answer: ¯d=d¯= (do not round) ∑(d−¯d)2=∑(d-d¯)2= (do not round) sd=sd= (rounded to one decimal place) b) Perform the hypothesis test in the following steps: Step 1.…A study found that 1 out of 200 adult males have green eyes. If a random sample of 400 adult males is obtained, is the sampling of the sample proportion of males that have green eyes approximately normal? A. Yes, the sample size is greater than 10% of the population. B. Yes, the sample was randomly selected C. No, because np < 10 D. No, because nq < 10Let X1, . . . , Xn ∼ iid Unif(θ1, θ2), where both θ1 and θ2 are unknown. Find the MOM estimator and compare them to the MLE.