Suppose you created a two-stock portfolio by investing $50,000 in High Tech and $50.000 in Collections. 1. Calculate the expected return (f.), the standard deviation (o.), the coefficient of variation (CV,), and the Sharpe ratio for this portfolio, and fill in the appropriate blanks in the table. 2. How dos the riskiness of this two-stock portfolio compare with the riskiness of the individual stocks if they were held in isolation?
Suppose you created a two-stock portfolio by investing $50,000 in High Tech and $50.000 in Collections. 1. Calculate the expected return (f.), the standard deviation (o.), the coefficient of variation (CV,), and the Sharpe ratio for this portfolio, and fill in the appropriate blanks in the table. 2. How dos the riskiness of this two-stock portfolio compare with the riskiness of the individual stocks if they were held in isolation?

Essentials Of Investments
11th Edition
ISBN:9781260013924
Author:Bodie, Zvi, Kane, Alex, MARCUS, Alan J.
Publisher:Bodie, Zvi, Kane, Alex, MARCUS, Alan J.
Chapter1: Investments: Background And Issues
Section: Chapter Questions
Problem 1PS

Related questions
Question
part f 1,2
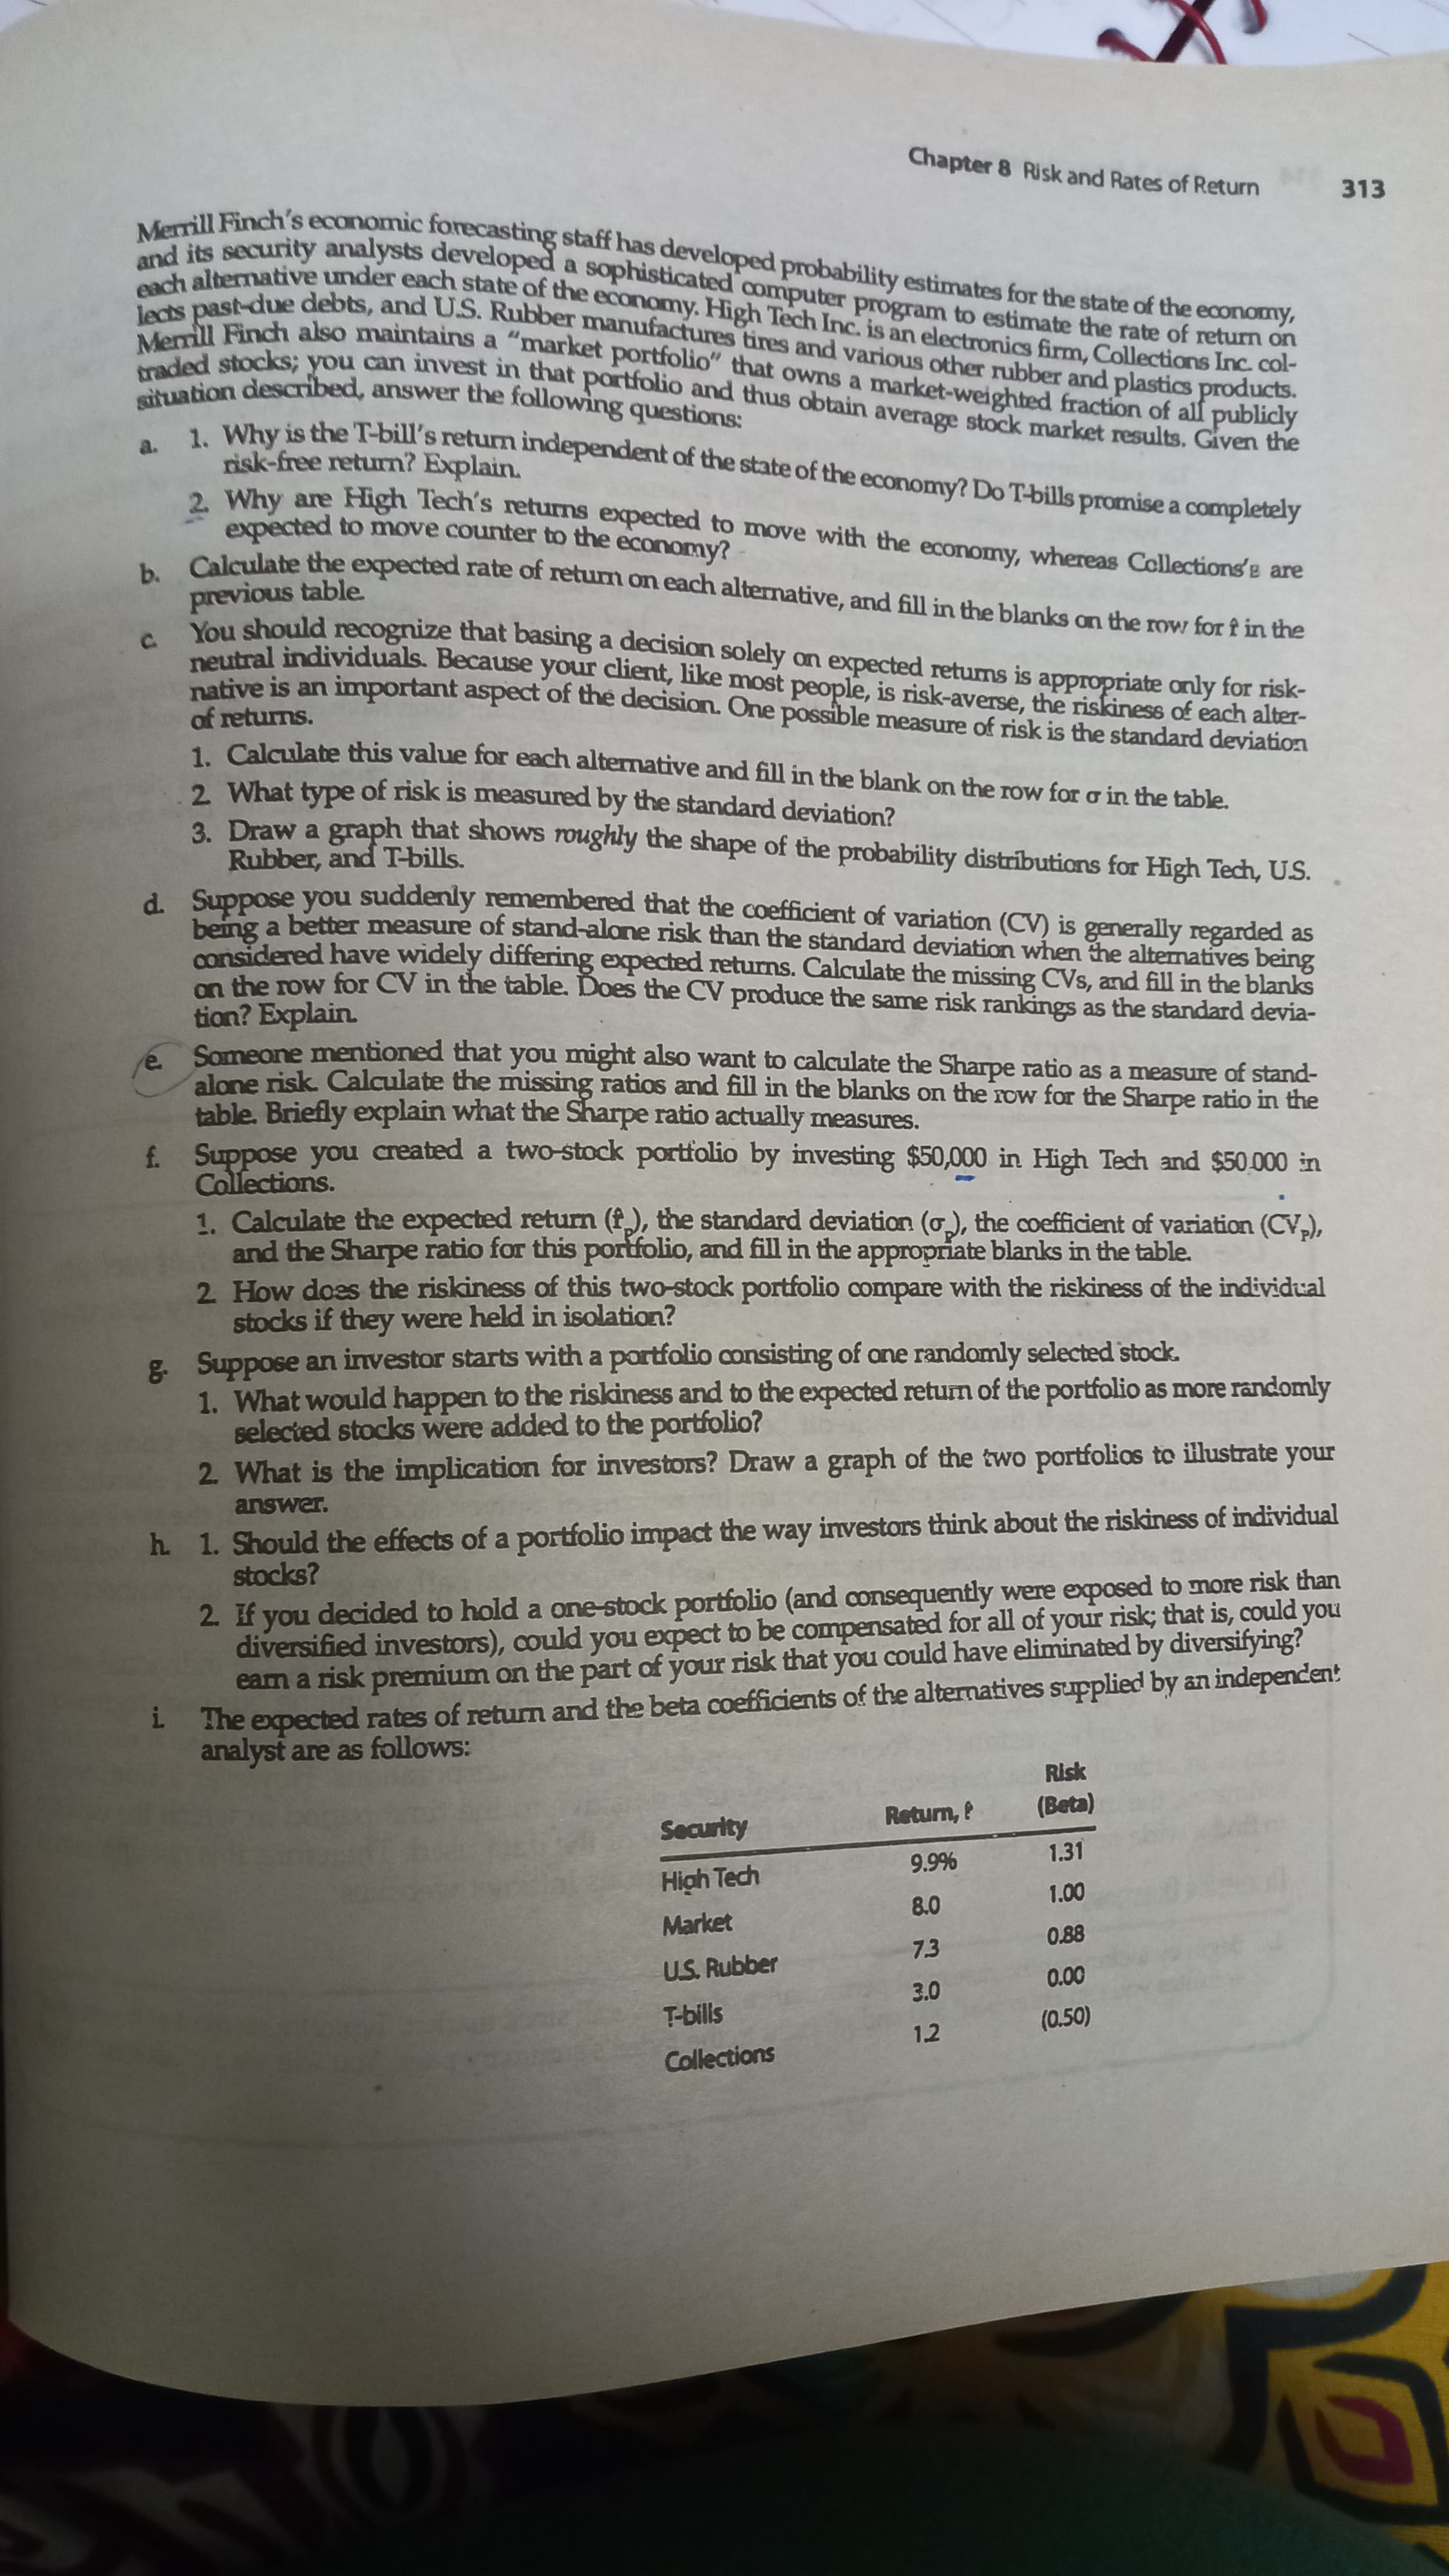
Transcribed Image Text:Chapter 8 Risk and Rates of Return
313
a
. Why is the T-bill's return independent of the state of the economy? Do T-bills promise a completely
risk-free return? Explain.
Why are High Tech's returns expected to move with the economy, whereas Collections'e are
expected to move counter to the economy?
previous table
u should recognize that basing a decision solely on expected returns is appropriate only for risk-
10 nal individuals. Because your client, like most people, is risk-averse, the riskiness of each alter-
tative is an important aspect of the decision. One possible measure of risk is the standard deviation
of returns.
1 Calgulate this value for each alternative and fill in the blank on the row for o in the table.
2. What type of risk is measured by the standard deviation?
3 Draw a graph that shows roughly the shape of the probability distributions for High Tech, U.S.
Rubber, and T-bills.
å Suppose you suddenly remembered that the coefficient of variation (CV) is generally regarded as
r a better measure of stand-alone risk than the standard deviation when the alternatives being
onsidered have widely differing expected returns. Calculate the missing CVs, and fill in the blanks
n the row for CV in the table. Does the CV produce the same risk rankings as the standard devia-
tion? Explain.
Someone mentioned that you might also want to calculate the Sharpe ratio as a measure of stand-
alone risk. Calculate the missing ratios and fill in the blanks on the row for the Sharpe ratio in the
table. Briefly explain what the Sharpe ratio actually measures.
f Suppose you created a two-stock portfolio by investing $50,000 in High Tech and $50.000 in
Collections.
1. Calculate the expected return (f), the standard deviation (o), the coefficient of variation (CV,),
and the Sharpe ratio for this portfolio, and fill in the appropriate blanks in the table.
2 How doss the riskiness of this two-stock portfolio compare with the riskiness of the individual
stocks if they were held in isolation?
g. Suppose an investor starts with a portfolio consisting of ane randomly selected stock.
1. What would happen to the riskiness and to the expected retum of the portfolio as more randomly
selected stocks were added to the portfolio?
2 What is the implication for investors? Draw a graph of the two portfolios to illustrate your
answer.
h 1. Should the effects of a portfolio impact the way investors think about the riskiness of individual
stocks?
2 If you decided to hold a one-stock portfolio (and consequently were exposed to more risk than
diversified investors), could you expect to be compensated for all of your risk; that is, could you
earn a risk premium on the part of your risk that you could have eliminated by diversifying?
1 The expected rates of retum and the beta coefficients of the alternatives supplied by an independen:
analyst are as follows:
Security
1.31
High Tech
%66
00 0
0.88
Market
7.3
U.S. Rubber
000
(0.50)
T-bills
1.2
Collections
Transcribed Image Text:百
Bartman, of Stock A, of Stock B, and 20% of C.
would the beta and return be?
a job as a with a Your f
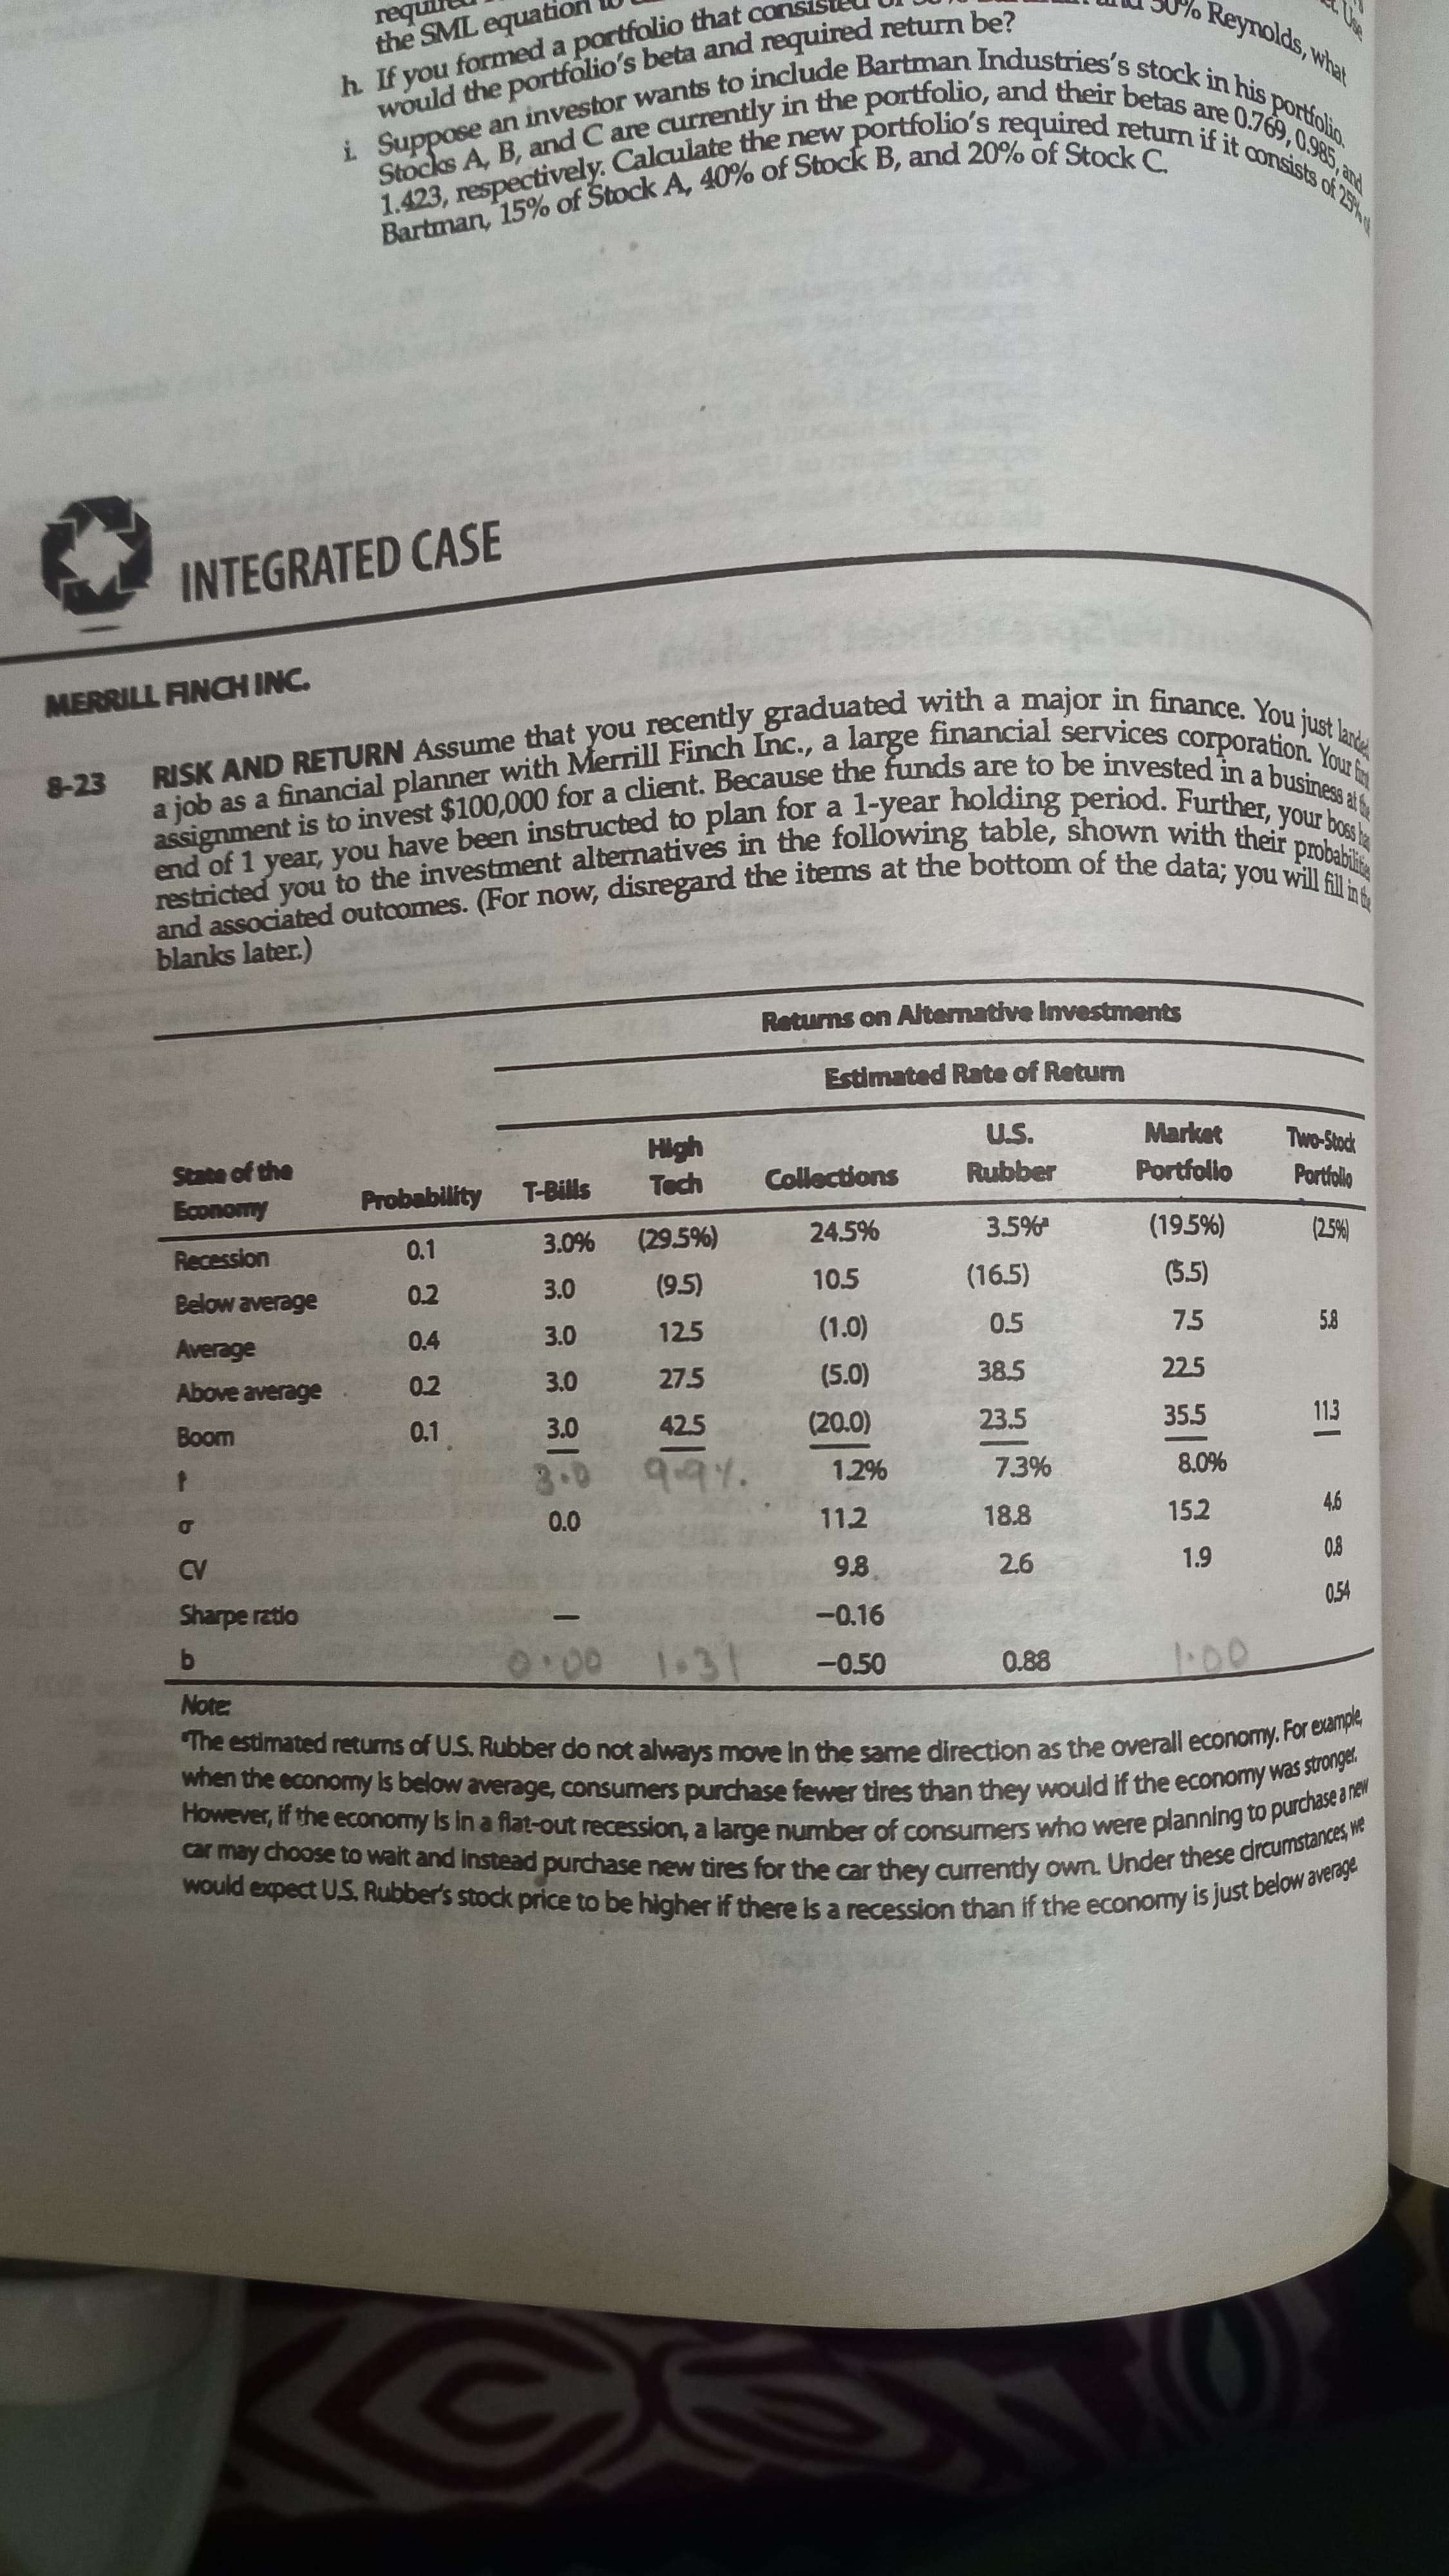
RISK AND RETURN that you a major in just lande
end of 1 you have been to plan for a bossla
assignment is to a client. the are to be in a a
and (For now, the items at of you will fill it
bar
the SML equation
h If you formed a portfolio that cons
restricted you to the in the with their probablite
i an to stock in his portfolio.
Reynolds, what
pue c86
INTEGRATED CASE
MERRILL FINCH INC.
8-23
a job as a financial planner with Merrill Finch Inc., a large
a
restricted
nou,
blanks later.)
Returns on Alternative Investments
Estimated Rate of Retum
U.S.
Rubber
Market
State of the
Probability T-Bills
Collections
Portfolio
Portfollo
AsOucog
24.5%
Recession
0.1
(29.5%)
(195%)
10.5
(16.5)
(5.5)
(5)
125
0.2
0.4
3.0
0.5
7.5
(0')
Above average
0.2
3.0
27.5
38.5
225
(O'S)
0.1
42.5
23.5
35.5
113
woog
3.0
997.
1.2%
7.3%
112
18.8
15.2
00
9.8
2.6
Sharpe ratio
-0.16
50
-0.50
0.88
1000
13
1.00
Expert Solution
This question has been solved!
Explore an expertly crafted, step-by-step solution for a thorough understanding of key concepts.

This is a popular solution!

Trending now
This is a popular solution!

Step by step
Solved in 3 steps with 5 images

Knowledge Booster


Learn more about
Need a deep-dive on the concept behind this application? Look no further. Learn more about this topic, finance and related others by exploring similar questions and additional content below.Recommended textbooks for you
Essentials Of Investments
Finance
ISBN:
9781260013924
Author:
Bodie, Zvi, Kane, Alex, MARCUS, Alan J.
Publisher:
Mcgraw-hill Education,


Essentials Of Investments
Finance
ISBN:
9781260013924
Author:
Bodie, Zvi, Kane, Alex, MARCUS, Alan J.
Publisher:
Mcgraw-hill Education,

Foundations Of Finance
Finance
ISBN:
9780134897264
Author:
KEOWN, Arthur J., Martin, John D., PETTY, J. William
Publisher:
Pearson,

Fundamentals of Financial Management (MindTap Cou…
Finance
ISBN:
9781337395250
Author:
Eugene F. Brigham, Joel F. Houston
Publisher:
Cengage Learning

Corporate Finance (The Mcgraw-hill/Irwin Series i…
Finance
ISBN:
9780077861759
Author:
Stephen A. Ross Franco Modigliani Professor of Financial Economics Professor, Randolph W Westerfield Robert R. Dockson Deans Chair in Bus. Admin., Jeffrey Jaffe, Bradford D Jordan Professor
Publisher:
McGraw-Hill Education