sured. This information is summarized in the following plot: Dosage vs Increase 80 70 60 50 p/bu u 1OH
sured. This information is summarized in the following plot: Dosage vs Increase 80 70 60 50 p/bu u 1OH

Chapter3: Performing Calculations With Formulas And Functions
Section: Chapter Questions
Problem 8RA

Related questions
Question
![You are working for a company that developed a new drug which increases HDL cholesterol (the good
cholesterol). A variety of dosages were given to participants during a trial, and the increases of HDL cholesterol
were measured. This information is summarized in the following plot:
Dosage vs Increase
80
70
60
50
40
30
20
10
15
x - dosage in mg
10
20
25
30
Each point (x, y) in the above plot represents a participant who was given a dosage of æ mg and had an HDL
increase of y mg/dL. This information is stored in the 2d numpy array trial_data. The r-values are stored in
the first row of trial_data (i.e. trial_data[@]) and the y-values are stored in the second row of trial_data (i.e.
trial_data[1]).
You are now working with a physician to determine the right dosage for one of her patients.
1) In order to help your client, first find a vector B =
[B1]
such that y(x) = B1 + Bza is the least squares line
[B2]
for the above data. Store the vector B as a 1D-numpy array in beta.
2) The physician wants to raise the HDL level by 34 mg/dL. What dosage do you recommend? Save this as
dosage.
Hint: Recall from lab the various ways to compute least squares solutions. Another function you might find
helpful is numpy.linalg.Istsq, though the methods used in lab are sufficient.
The setup code gives the following variables:
Name
Туре
Description
trial_data
numpy array
trial data
display_regression
function
helper function to display least squares line
y - increase in HDL in mg/dL](/v2/_next/image?url=https%3A%2F%2Fcontent.bartleby.com%2Fqna-images%2Fquestion%2F7efbac67-280b-47ce-af45-566f001a1f6a%2F0d7bc3f3-edb2-4aae-90db-c5968e9945cd%2Fo2f5h4a_processed.jpeg&w=3840&q=75)
Transcribed Image Text:You are working for a company that developed a new drug which increases HDL cholesterol (the good
cholesterol). A variety of dosages were given to participants during a trial, and the increases of HDL cholesterol
were measured. This information is summarized in the following plot:
Dosage vs Increase
80
70
60
50
40
30
20
10
15
x - dosage in mg
10
20
25
30
Each point (x, y) in the above plot represents a participant who was given a dosage of æ mg and had an HDL
increase of y mg/dL. This information is stored in the 2d numpy array trial_data. The r-values are stored in
the first row of trial_data (i.e. trial_data[@]) and the y-values are stored in the second row of trial_data (i.e.
trial_data[1]).
You are now working with a physician to determine the right dosage for one of her patients.
1) In order to help your client, first find a vector B =
[B1]
such that y(x) = B1 + Bza is the least squares line
[B2]
for the above data. Store the vector B as a 1D-numpy array in beta.
2) The physician wants to raise the HDL level by 34 mg/dL. What dosage do you recommend? Save this as
dosage.
Hint: Recall from lab the various ways to compute least squares solutions. Another function you might find
helpful is numpy.linalg.Istsq, though the methods used in lab are sufficient.
The setup code gives the following variables:
Name
Туре
Description
trial_data
numpy array
trial data
display_regression
function
helper function to display least squares line
y - increase in HDL in mg/dL
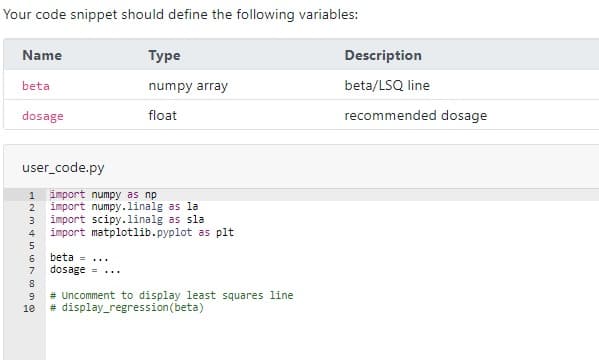
Transcribed Image Text:Your code snippet should define the following variables:
Name
Туре
Description
beta
numpy array
beta/LSQ line
dosage
float
recommended dosage
user_code.py
1 import numpy as np
import numpy.linalg as la
import scipy.linalg as sla
import matplotlib.pyplot as plt
2
3
4
5
6.
beta =...
7
dosage = ...
9
# Uncomment to display least squares line
10
# display_regression(beta)
Expert Solution
This question has been solved!
Explore an expertly crafted, step-by-step solution for a thorough understanding of key concepts.

Step by step
Solved in 3 steps with 2 images

Knowledge Booster


Learn more about
Need a deep-dive on the concept behind this application? Look no further. Learn more about this topic, computer-science and related others by exploring similar questions and additional content below.Recommended textbooks for you
Np Ms Office 365/Excel 2016 I Ntermed
Computer Science
ISBN:
9781337508841
Author:
Carey
Publisher:
Cengage
Np Ms Office 365/Excel 2016 I Ntermed
Computer Science
ISBN:
9781337508841
Author:
Carey
Publisher:
Cengage