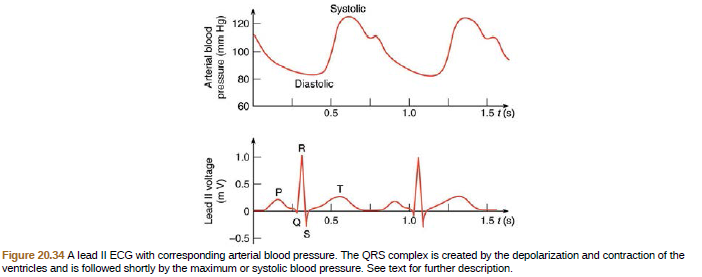
Systolic 120 100 80 Diastolic 60 0.5 1.0 1.5 1 (s) 1.0 0.5 0.5 1.5 (8) -0.5E Figure 20.34 A lead II ECG with corresponding arterial blood pressure. The QRS complex is created by the depolarization and contraction of the ventricles and is followed shortly by the maximum or systolic blood pressure. See text for further description.
Systolic 120 100 80 Diastolic 60 0.5 1.0 1.5 1 (s) 1.0 0.5 0.5 1.5 (8) -0.5E Figure 20.34 A lead II ECG with corresponding arterial blood pressure. The QRS complex is created by the depolarization and contraction of the ventricles and is followed shortly by the maximum or systolic blood pressure. See text for further description.

College Physics
1st Edition
ISBN:9781938168000
Author:Paul Peter Urone, Roger Hinrichs
Publisher:Paul Peter Urone, Roger Hinrichs
Chapter20: Electric Current, Resistance, And Ohm's Law
Section: Chapter Questions
Problem 96PE: Integrated Concepts (a) Referring to Figure 20.34, find the time systolic pressure lags behind the...

Related questions
Question
Use the ECG figure shown to determine the heart rate in
beats per minute assuming a constant time between beats.
Transcribed Image Text:Systolic
120
100
80
Diastolic
60
0.5
1.0
1.5 1 (s)
1.0
0.5
0.5
1.5 (8)
-0.5E
Figure 20.34 A lead II ECG with corresponding arterial blood pressure. The QRS complex is created by the depolarization and contraction of the
ventricles and is followed shortly by the maximum or systolic blood pressure. See text for further description.
Expert Solution
This question has been solved!
Explore an expertly crafted, step-by-step solution for a thorough understanding of key concepts.

Step by step
Solved in 2 steps with 2 images

Knowledge Booster


Learn more about
Need a deep-dive on the concept behind this application? Look no further. Learn more about this topic, physics and related others by exploring similar questions and additional content below.Recommended textbooks for you
College Physics
Physics
ISBN:
9781938168000
Author:
Paul Peter Urone, Roger Hinrichs
Publisher:
OpenStax College

College Physics
Physics
ISBN:
9781938168000
Author:
Paul Peter Urone, Roger Hinrichs
Publisher:
OpenStax College