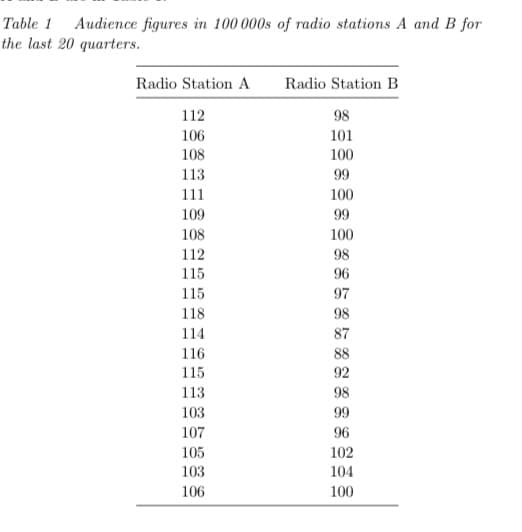
Table 1 Audience figures in 100 000s of radio stations A and B for the last 20 quarters. Radio Station A 112 106 108 113 111 109 108 112 115 115 118 114 116 115 113 103 107 105 103 106 Radio Station B 98 101 100 99 100 99 100 98 96 97 98 87 88 92 98 99 96 102 104 100
Table 1 Audience figures in 100 000s of radio stations A and B for the last 20 quarters. Radio Station A 112 106 108 113 111 109 108 112 115 115 118 114 116 115 113 103 107 105 103 106 Radio Station B 98 101 100 99 100 99 100 98 96 97 98 87 88 92 98 99 96 102 104 100

Holt Mcdougal Larson Pre-algebra: Student Edition 2012
1st Edition
ISBN:9780547587776
Author:HOLT MCDOUGAL
Publisher:HOLT MCDOUGAL
Chapter11: Data Analysis And Probability
Section11.5: Interpreting Data
Problem 1C

Related questions
Question
Transcribed Image Text:Table 1 Audience figures in 100 000s of radio stations A and B for
the last 20 quarters.
Radio Station A
112
106
108
113
111
109
108
112
115
115
118
114
116
115
113
103
107
105
103
106
Radio Station B
98
101
100
99
100
99
100
98
96
97
98
87
88
92
98
99
96
102
104
100
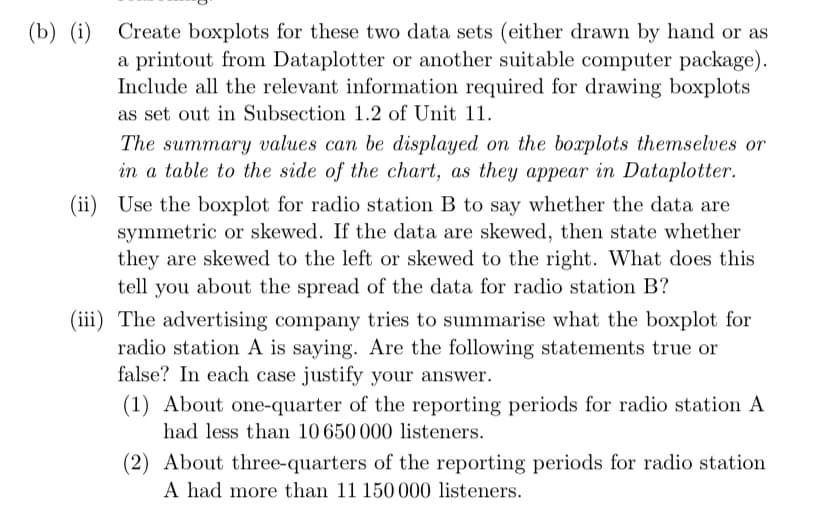
Transcribed Image Text:(b) (i) Create boxplots for these two data sets (either drawn by hand or as
a printout from Dataplotter or another suitable computer package).
Include all the relevant information required for drawing boxplots
as set out in Subsection 1.2 of Unit 11.
The summary values can be displayed on the boxplots themselves or
in a table to the side of the chart, as they appear in Dataplotter.
(ii) Use the boxplot for radio station B to say whether the data are
symmetric or skewed. If the data are skewed, then state whether
they are skewed to the left or skewed to the right. What does this
tell you about the spread of the data for radio station B?
(iii) The advertising company tries to summarise what the boxplot for
radio station A is saying. Are the following statements true or
false? In each case justify your answer.
(1) About one-quarter of the reporting periods for radio station A
had less than 10 650 000 listeners.
(2) About three-quarters of the reporting periods for radio station
A had more than 11 150 000 listeners.
Expert Solution
This question has been solved!
Explore an expertly crafted, step-by-step solution for a thorough understanding of key concepts.

Step by step
Solved in 4 steps with 2 images

Recommended textbooks for you
Holt Mcdougal Larson Pre-algebra: Student Edition…
Algebra
ISBN:
9780547587776
Author:
HOLT MCDOUGAL
Publisher:
HOLT MCDOUGAL
Holt Mcdougal Larson Pre-algebra: Student Edition…
Algebra
ISBN:
9780547587776
Author:
HOLT MCDOUGAL
Publisher:
HOLT MCDOUGAL