Table 1: The number of different beetle species recovered in the Combo.. Combination 1 Combination 2 Combination 3 three quadrats randomly thrown in Area C, Species 1 1 3 2. 2 3 1. Species Sample 1 Sample 2 Sample 3 alpha 3. 3 2. 3. alpha beta 1. 1 beta 1 1 gamma 10 11 6. 10 9 11 11 10 gamma 10 11 9 delta 0. 8. 0. 0. 8. delta 8. epsilon 7 7 0. 7 epsilon zeta 4 0. 0. 4 4 zeta 4 eta 12 12 0. 12 eta 12 theta 1 0. 1 0. 1 theta 0. 1 lota 1 1. 1 lota Total 4 6. 3 4 3 9. 6. 3 Draw a species accumulation curve for the beetles in Area C, from these three samples. Make sure you label the axes and that you provide a legend. You need to reassemble the samples in all possible combinations in order to derive the species area curve. Unique 4 4. 1 4 2 3. 2. Cumulative 4 8 9 4 9. 9. 7 unique
Table 1: The number of different beetle species recovered in the Combo.. Combination 1 Combination 2 Combination 3 three quadrats randomly thrown in Area C, Species 1 1 3 2. 2 3 1. Species Sample 1 Sample 2 Sample 3 alpha 3. 3 2. 3. alpha beta 1. 1 beta 1 1 gamma 10 11 6. 10 9 11 11 10 gamma 10 11 9 delta 0. 8. 0. 0. 8. delta 8. epsilon 7 7 0. 7 epsilon zeta 4 0. 0. 4 4 zeta 4 eta 12 12 0. 12 eta 12 theta 1 0. 1 0. 1 theta 0. 1 lota 1 1. 1 lota Total 4 6. 3 4 3 9. 6. 3 Draw a species accumulation curve for the beetles in Area C, from these three samples. Make sure you label the axes and that you provide a legend. You need to reassemble the samples in all possible combinations in order to derive the species area curve. Unique 4 4. 1 4 2 3. 2. Cumulative 4 8 9 4 9. 9. 7 unique

Biology: The Unity and Diversity of Life (MindTap Course List)
15th Edition
ISBN:9781337408332
Author:Cecie Starr, Ralph Taggart, Christine Evers, Lisa Starr
Publisher:Cecie Starr, Ralph Taggart, Christine Evers, Lisa Starr
Chapter1: Invitation To Biology
Section: Chapter Questions
Problem 15SA: Match the terms with the most suitable description. ____ data a. ifthen statement ____ probability...

Related questions
Question
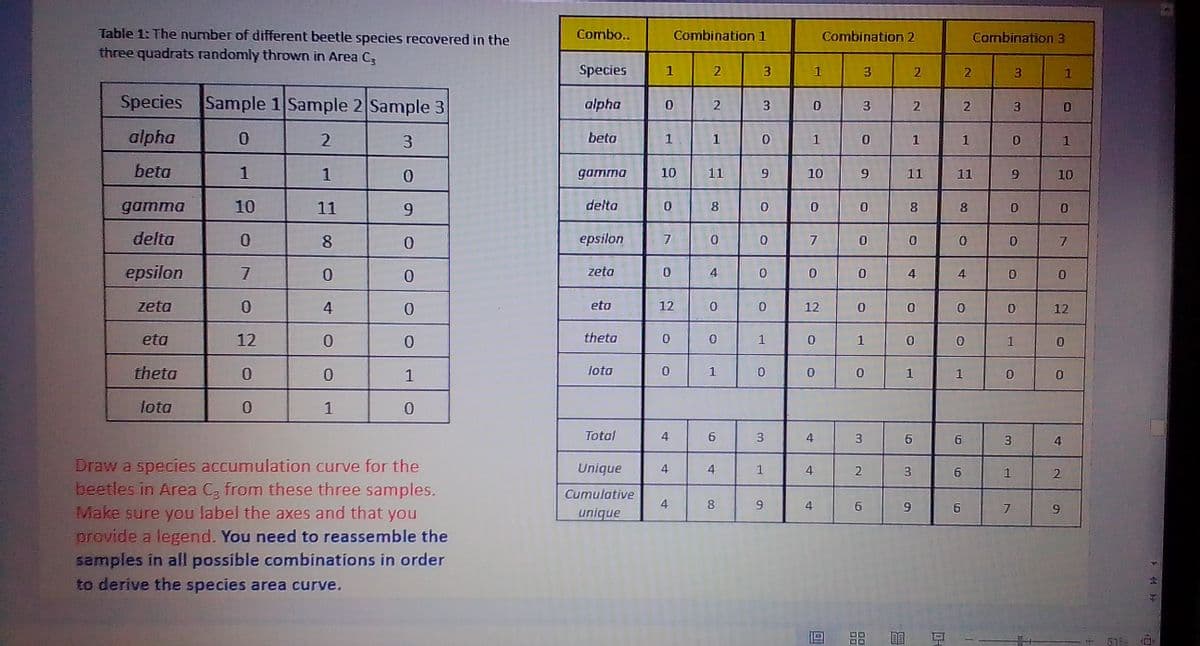
Draw a species accumulation curve for the beetles in Area C3, based on the data shown in Table 1. Ensure that you calculate a standard deviation around each average number of species per sample; plot this on this figure. Make sure you label the axes and that you provide a legend
Transcribed Image Text:Table 1: The number of different beetle species recovered in the
three quadrats randomly thrown in Area C3
Combo..
Combination 1
Combination 2
Cormbination 3
Species
1
3.
3.
1
Species Sample 1 Sample 2 Sample 3
alpha
3
3
2
3.
alpha
beta
1
1
1
1
1
beta
1
1
gamma
10
11
10
11
11
10
gamma
10
11
delta
8.
0.
8.
8.
delta
8.
epsilon
epsilon
zeta
4
0.
4
0.
zeta
4
eta
12
12
12
eta
12
theta
1
0.
theta
1
lota
1
0.
1
1
lota
1
Total
4.
6.
3.
4
3.
9.
6.
3
Draw a species accumulation curve for the
beetles in Area C, from these three samples.
Make sure you label the axes and that you
provide a legend. You need to reassemble the
samples in all possible combinations in order
to derive the species area curve.
Unique
4
4
4
1
2.
Cumulative
8.
4
6.
7
unique
519-
ト
4)
2.
2.
st
Expert Solution
This question has been solved!
Explore an expertly crafted, step-by-step solution for a thorough understanding of key concepts.

Step by step
Solved in 3 steps with 3 images

Recommended textbooks for you
Biology: The Unity and Diversity of Life (MindTap…
Biology
ISBN:
9781337408332
Author:
Cecie Starr, Ralph Taggart, Christine Evers, Lisa Starr
Publisher:
Cengage Learning


Biology 2e
Biology
ISBN:
9781947172517
Author:
Matthew Douglas, Jung Choi, Mary Ann Clark
Publisher:
OpenStax
Biology: The Unity and Diversity of Life (MindTap…
Biology
ISBN:
9781337408332
Author:
Cecie Starr, Ralph Taggart, Christine Evers, Lisa Starr
Publisher:
Cengage Learning
Biology 2e
Biology
ISBN:
9781947172517
Author:
Matthew Douglas, Jung Choi, Mary Ann Clark
Publisher:
OpenStax

Biology: The Unity and Diversity of Life (MindTap…
Biology
ISBN:
9781305073951
Author:
Cecie Starr, Ralph Taggart, Christine Evers, Lisa Starr
Publisher:
Cengage Learning