Group 2: Snakes were placed on an island where there is only once size of burrow available for the snakes to live in. Number of Snake at Each Length 2cm 4cm бст 8cm 10сm Year 1980 4 12 16 10 3 1984 10 18 3 1988 6 24 2. 1. Graph the data and paste your graph here. Make sure and include title, x and y labels, units and a key to indicate which color represents each year.
Group 2: Snakes were placed on an island where there is only once size of burrow available for the snakes to live in. Number of Snake at Each Length 2cm 4cm бст 8cm 10сm Year 1980 4 12 16 10 3 1984 10 18 3 1988 6 24 2. 1. Graph the data and paste your graph here. Make sure and include title, x and y labels, units and a key to indicate which color represents each year.

Human Biology (MindTap Course List)
11th Edition
ISBN:9781305112100
Author:Cecie Starr, Beverly McMillan
Publisher:Cecie Starr, Beverly McMillan
Chapter23: Principles Of Evolution
Section: Chapter Questions
Problem 2RQ: As shown in Figure 23.25, there is considerable variation in the facial features of humans. Explain...

Related questions

Question
Transcribed Image Text:Search the menus (Alt+/)
BI U A
100%
Normal text
Calibri
18
+
...
2
I 3 II| I4 | 5
6
- Types of Natural Selection
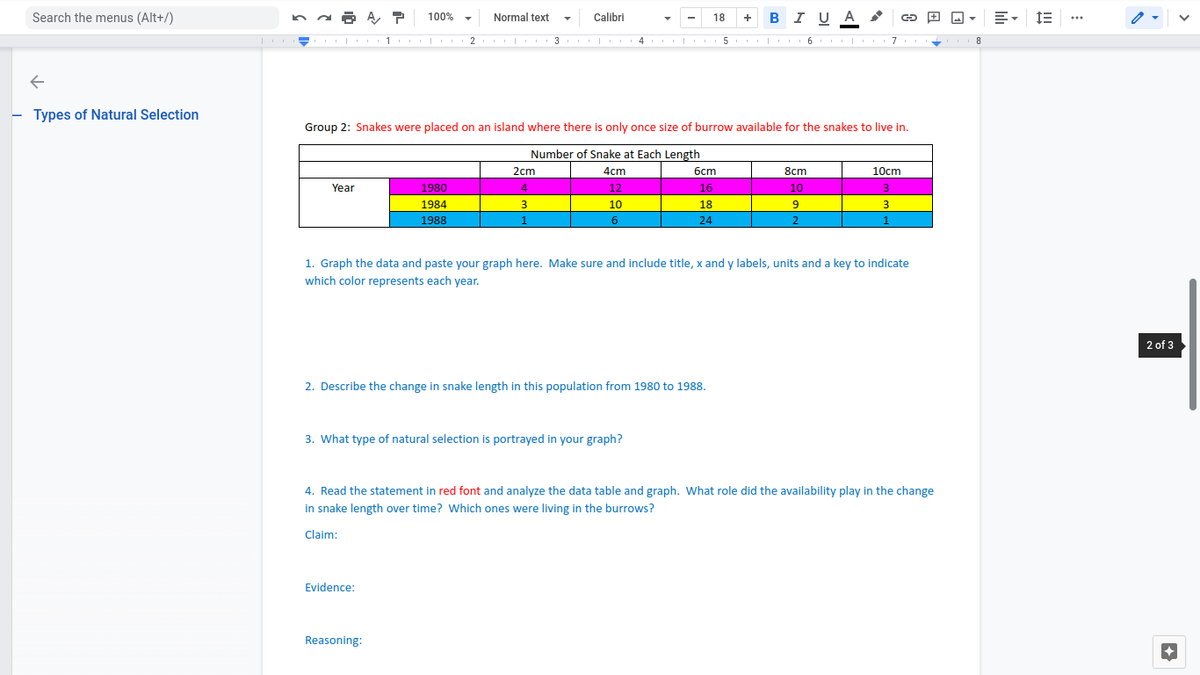
Group 2: Snakes were placed on an island where there is only once size of burrow available for the snakes to live in.
Number of Snake at Each Length
2cm
4cm
бст
8cm
10cm
Year
1980
4
12
16
10
3.
1984
10
18
3
1988
1
6
24
2.
1
1. Graph the data and paste your graph here. Make sure and include title, x and y labels, units and a key to indicate
which color represents each year.
2 of 3
2. Describe the change in snake length in this population from 1980 to 1988.
3. What type of natural selection is portrayed in your graph?
4. Read the statement in red font and analyze the data table and graph. What role did the availability play in the change
in snake length over time? Which ones were living in the burrows?
Claim:
Evidence:
Reasoning:
Expert Solution
This question has been solved!
Explore an expertly crafted, step-by-step solution for a thorough understanding of key concepts.

This is a popular solution!

Trending now
This is a popular solution!

Step by step
Solved in 2 steps with 1 images

Knowledge Booster


Learn more about
Need a deep-dive on the concept behind this application? Look no further. Learn more about this topic, biology and related others by exploring similar questions and additional content below.Recommended textbooks for you
Human Biology (MindTap Course List)
Biology
ISBN:
9781305112100
Author:
Cecie Starr, Beverly McMillan
Publisher:
Cengage Learning
Human Biology (MindTap Course List)
Biology
ISBN:
9781305112100
Author:
Cecie Starr, Beverly McMillan
Publisher:
Cengage Learning