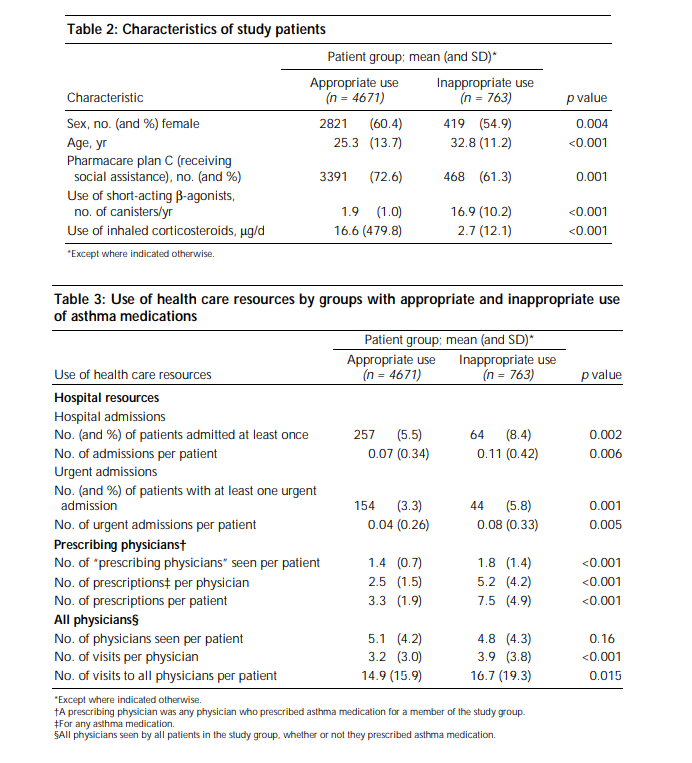
Table 2: Characteristics of study patients Patient group; mean (and SD)* Appropriate use (n = 4671) Inappropriate use (n = 763) p value Characteristic Sex, no. (and %) female 2821 (60.4) 419 (54.9) 0.004 25.3 (13.7) 32.8 (11.2) Age, yr Pharmacare plan C (receiving social assistance), no. (and %) <0.001 3391 (72.6) 468 (61.3) 0.001

3-2-1 Code It
6th Edition
ISBN:9781337660549
Author:GREEN
Publisher:GREEN
Chapter19: Insurance And Reimbursement
Section: Chapter Questions
Problem 13MC
icon
Related questions
Question

Please explain the Data in the graphs

Table 2: Characteristics of study patients
Patient group; mean (and SD)*
Appropriate use
(n = 4671)
Inappropriate use
(n = 763)
p value
Characteristic
Sex, no. (and %) female
2821
419 (54.9)
(60.4)
25.3 (13.7)
0.004
Age, yr
Pharmacare plan C (receiving
social assistance), no. (and %)
32.8 (11.2)
<0.001
3391
(72.6)
468 (61.3)
0.001
Use of short-acting ß-agonists,
no. of canisters/yr
Use of inhaled corticosteroids, ug/d
1.9
(1.0)
16.9 (10.2)
<0.001
16.6 (479.8)
2.7 (12.1)
<0.001
"Except where indicated otherwise.
Table 3: Use of health care resources by groups with appropriate and inappropriate use
of asthma medications
Patient group; mean (and SD)*
Appropriate use
(n = 4671)
Inappropriate use
(n = 763)
p value
Use of health care resources
Hospital resources
Hospital admissions
No. (and %) of patients admitted at least once
No. of admissions per patient
257
(5.5)
64
(8.4)
0.002
0.07 (0.34)
0.11 (0.42)
0.006
Urgent admissions
No. (and %) of patients with at least one urgent
admission
154
(3.3)
44
(5.8)
0.001
No. of urgent admissions per patient
0.04 (0.26)
0.08 (0.33)
0.005
Prescribing physicianst
No. of "prescribing physicians" seen per patient
1.4 (0.7)
1.8 (1.4)
<0.001
2.5 (1.5)
5.2 (4.2)
7.5 (4.9)
No. of prescriptionst per physician
No. of prescriptions per patient
All physicianss
No. of physicians seen per patient
No. of visits per physician
<0.001
3.3 (1.9)
<0.001
5.1 (4.2)
3.2 (3.0)
4.8 (4.3)
3.9 (3.8)
0.16
<0.001
No. of visits to all physicians per patient
14.9 (15.9)
16.7 (19.3)
0.015
"Except where indicated otherwise.
tA prescribing physician was any physician who prescribed asthma medication for a member of the study group.
#For any asthma medication.
ŞAII physicians seen by all patients in the study group, whether or not they prescribed asthma medication.
Transcribed Image Text:Table 2: Characteristics of study patients Patient group; mean (and SD)* Appropriate use (n = 4671) Inappropriate use (n = 763) p value Characteristic Sex, no. (and %) female 2821 419 (54.9) (60.4) 25.3 (13.7) 0.004 Age, yr Pharmacare plan C (receiving social assistance), no. (and %) 32.8 (11.2) <0.001 3391 (72.6) 468 (61.3) 0.001 Use of short-acting ß-agonists, no. of canisters/yr Use of inhaled corticosteroids, ug/d 1.9 (1.0) 16.9 (10.2) <0.001 16.6 (479.8) 2.7 (12.1) <0.001 "Except where indicated otherwise. Table 3: Use of health care resources by groups with appropriate and inappropriate use of asthma medications Patient group; mean (and SD)* Appropriate use (n = 4671) Inappropriate use (n = 763) p value Use of health care resources Hospital resources Hospital admissions No. (and %) of patients admitted at least once No. of admissions per patient 257 (5.5) 64 (8.4) 0.002 0.07 (0.34) 0.11 (0.42) 0.006 Urgent admissions No. (and %) of patients with at least one urgent admission 154 (3.3) 44 (5.8) 0.001 No. of urgent admissions per patient 0.04 (0.26) 0.08 (0.33) 0.005 Prescribing physicianst No. of "prescribing physicians" seen per patient 1.4 (0.7) 1.8 (1.4) <0.001 2.5 (1.5) 5.2 (4.2) 7.5 (4.9) No. of prescriptionst per physician No. of prescriptions per patient All physicianss No. of physicians seen per patient No. of visits per physician <0.001 3.3 (1.9) <0.001 5.1 (4.2) 3.2 (3.0) 4.8 (4.3) 3.9 (3.8) 0.16 <0.001 No. of visits to all physicians per patient 14.9 (15.9) 16.7 (19.3) 0.015 "Except where indicated otherwise. tA prescribing physician was any physician who prescribed asthma medication for a member of the study group. #For any asthma medication. ŞAII physicians seen by all patients in the study group, whether or not they prescribed asthma medication.
Expert Solution
Step 1

Standard Deviation in Population --The standard deviation is a statistics which measure the dispersion of a dataset relative to mean and is calculated as the square root of the variance .

The standard deviation is calculated as the square root of variance by determining each data points deviation relative to mean .

If data points are farther from the mean there is a higher deviation with in the data set , thus the more spread out the data ,the higher the standard deviation.

Calculation of Standard Deviation --Standard Deviation is calculated as ---

1- The mean value is calculated by adding all the data points and dividing them by number of data points .

2 - The variance for each data point is calculated by subtracting the mean from the value of the data point .

Each of the values is then squared and the results summed .

The result is then divided by the number of data points less one .

3 - The square root of the variance - result from no.2 - is then used to find the standard deviation .

Importance of the Standard Deviation -- 

High Standard Deviation Mean -- A large standard deviation indicates that there is a lot of variance in the observed data around the mean .

This indicates that the data observed is quite spread out .

Small Standard Deviation Mean -- A small or low standard deviation indicates instead that much of the data observed is clustered tightly around the mean .

Standard Error --The standard error is a standard deviation of its sampling distribution or an estimate of that standard deviation .

Standard error explains how accurate the mean of any given sample from that population is likely to be compared to the true population mean .

When standard error increases i.e. it becomes more likely that any given mean is an inaccurate representation of the true population mean .

Hypothesis-- Generation of hypothesis is the beginning of a scientific process ,refers to a supposition based on reasoning and evidence .

Hypothesis is tested on the basis of observations and experiments which then provide facts and forecast possible out comes .

Types of Hypothesis -Hypothesis can be inductive or deductive , simple or complex , null or alternative .

1 - Null Hypothesis -- Null hypothesis is the hypothesis which is to be actually tested .There is no significant difference between the heights of the sample compared with the rational average .

It denote certain value of population parameters. Null hypothesis can be rejected but it can not be accepted just on the basis of a single test , a hypothesis in which there is no significant difference exists between the set of variables .

It is the original or default statement with no effect .

Represented by H0 (  H - 0 )

It is always hypothesis that is tested .

It denotes certain value of population parameter

2 - Alternative Hypothesis -- There is a significant difference between the heights of the sample , compared with the national average .

It is often referred to as the hypothesis other than the null hypothesis often denoted by 

H1 ( H - one ) .

Researcher seeks to prove in an indirect way , by using the test , refers to a certain value of sample statistic .

The acceptance of alternative hypothesis depends on the rejection of null hypothesis means until and unless null hypothesis is rejected an alternative hypothesis can not be accepted .

On Tailed and Two Tailed Hypothesis Test ---

One Tailed Test of Hypothesis -- A one tailed test has the entire 5% of the alpha level in one tail , either in left tail or right tail .

Two Tailed Test of Hypothesis -- A two tailed test splits the alpha level in half.

Indication of Use of One Tailed or Two Tailed Testing of Hypothesis -- In medical testing , one is generally interested in whether a treatment results in out comes which are better than chance ,thus a one tailed test should be performed  .A worse outcome is also interesting for the scientific field , there fore one should use a two tailed test which corresponds instead to testing .

steps

Step by step

Solved in 2 steps

Blurred answer
Knowledge Booster
Genomics
Learn more about
Need a deep-dive on the concept behind this application? Look no further. Learn more about this topic, biology and related others by exploring similar questions and additional content below.
Similar questions
  • SEE MORE QUESTIONS
Recommended textbooks for you
3-2-1 Code It
3-2-1 Code It
Biology
ISBN:
9781337660549
Author:
GREEN
Publisher:
Cengage
Essentials Health Info Management Principles/Prac…
Health & Nutrition
ISBN:
9780357191651
Author:
Bowie
Publisher:
Cengage
Nutrition Now
Nutrition Now
Health & Nutrition
ISBN:
9781337415408
Author:
Brown
Publisher:
Cengage