Table 2 Graphic Averaging Method Riser Block Thickness T= 1 in. = 2.54 x 10 m Distance between leveling screws L = 2.805 Distance Traveled Average Time tay 2 tav Error in t (s) alde d (m) (s) う5 4.02 13,16 2.33 1 1.5 5.75 33.00 5.06 6.56 5.97 2.25 713 49.84 3 3.00 8.29 61.72 4. min: max: ave: Error: Slope, S, of d vs. f graph (m/s).OH74 .0s21.04975 11.2%. Acceleration due to gravity g = 2S4 m/s? 土 % Difference Compared to g= 9.80 m/sec", %. iveg el el ban How well does the experiment with the standard value of g relative to the estimated error in the experiment? Is it within 1 error bar? 2error bars? More?
Table 2 Graphic Averaging Method Riser Block Thickness T= 1 in. = 2.54 x 10 m Distance between leveling screws L = 2.805 Distance Traveled Average Time tay 2 tav Error in t (s) alde d (m) (s) う5 4.02 13,16 2.33 1 1.5 5.75 33.00 5.06 6.56 5.97 2.25 713 49.84 3 3.00 8.29 61.72 4. min: max: ave: Error: Slope, S, of d vs. f graph (m/s).OH74 .0s21.04975 11.2%. Acceleration due to gravity g = 2S4 m/s? 土 % Difference Compared to g= 9.80 m/sec", %. iveg el el ban How well does the experiment with the standard value of g relative to the estimated error in the experiment? Is it within 1 error bar? 2error bars? More?

Stars and Galaxies
9th Edition
ISBN:9781305120785
Author:Michael A. Seeds, Dana Backman
Publisher:Michael A. Seeds, Dana Backman
Chapter9: The Famliy Of Stars
Section: Chapter Questions
Problem 2DQ

Related questions
Question
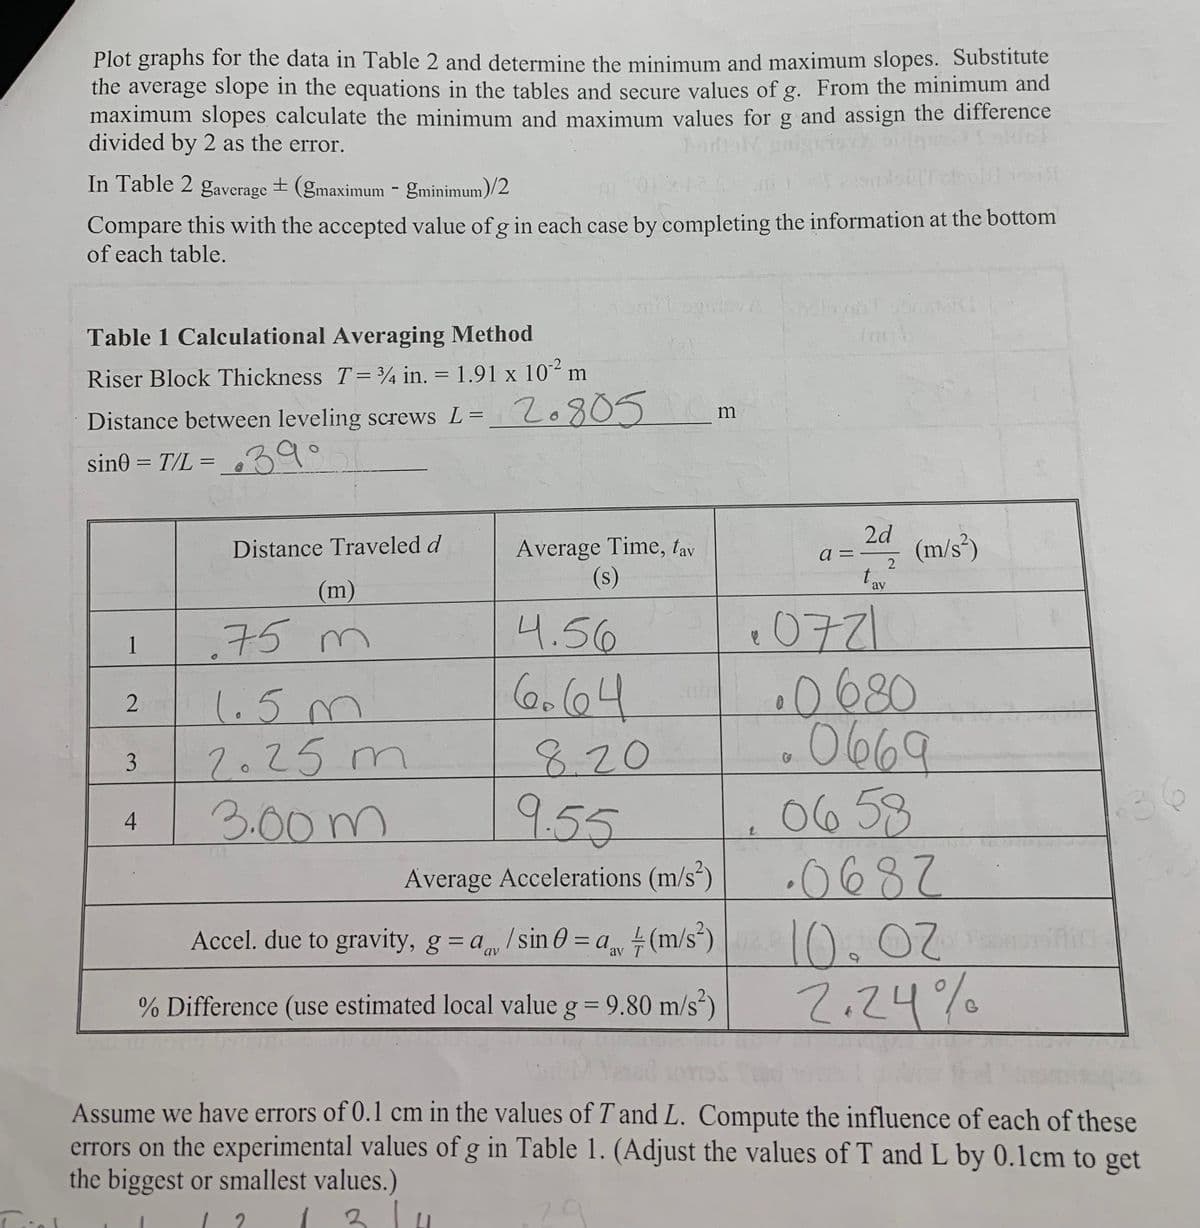
Transcribed Image Text:Plot graphs for the data in Table 2 and determine the minimum and maximum slopes. Substitute
the average slope in the equations in the tables and secure values of g. From the minimum and
maximum slopes calculate the minimum and maximum values for g and assign the difference
divided by 2 as the error.
bo
In Table 2 gaverage + (gmaximum - gminimum)/2
Compare this with the accepted value of g in each case by completing the information at the bottom
of each table.
Table 1 Calculational Averaging Method
Riser Block Thickness T= ¾ in. = 1.91 x 10 m
%3D
2.805
m
Distance between leveling screws L =
sin0 = T/L =
.39°
2d
Average Time, tav
(s)
(m/s²)
Distance Traveled d
a =
2
t.
Tay
(m)
.0721
.0680
0669
0658
.0682
10.02
2.24%
75 m
4.56
1
1.5m
7.25m
3.00m
8.20
9.55
36
4
Average Accelerations (m/s)
Accel. due to gravity, g = a/sin 0 = a (m/s*)
% Difference (use estimated local value g = 9.80 m/s)
%3D
Assume we have errors of 0.1 cm in the values of T and L. Compute the influence of each of these
errors on the experimental values of g in Table 1. (Adjust the values of T and L by 0.1cm to get
the biggest or smallest values.)
29
3.
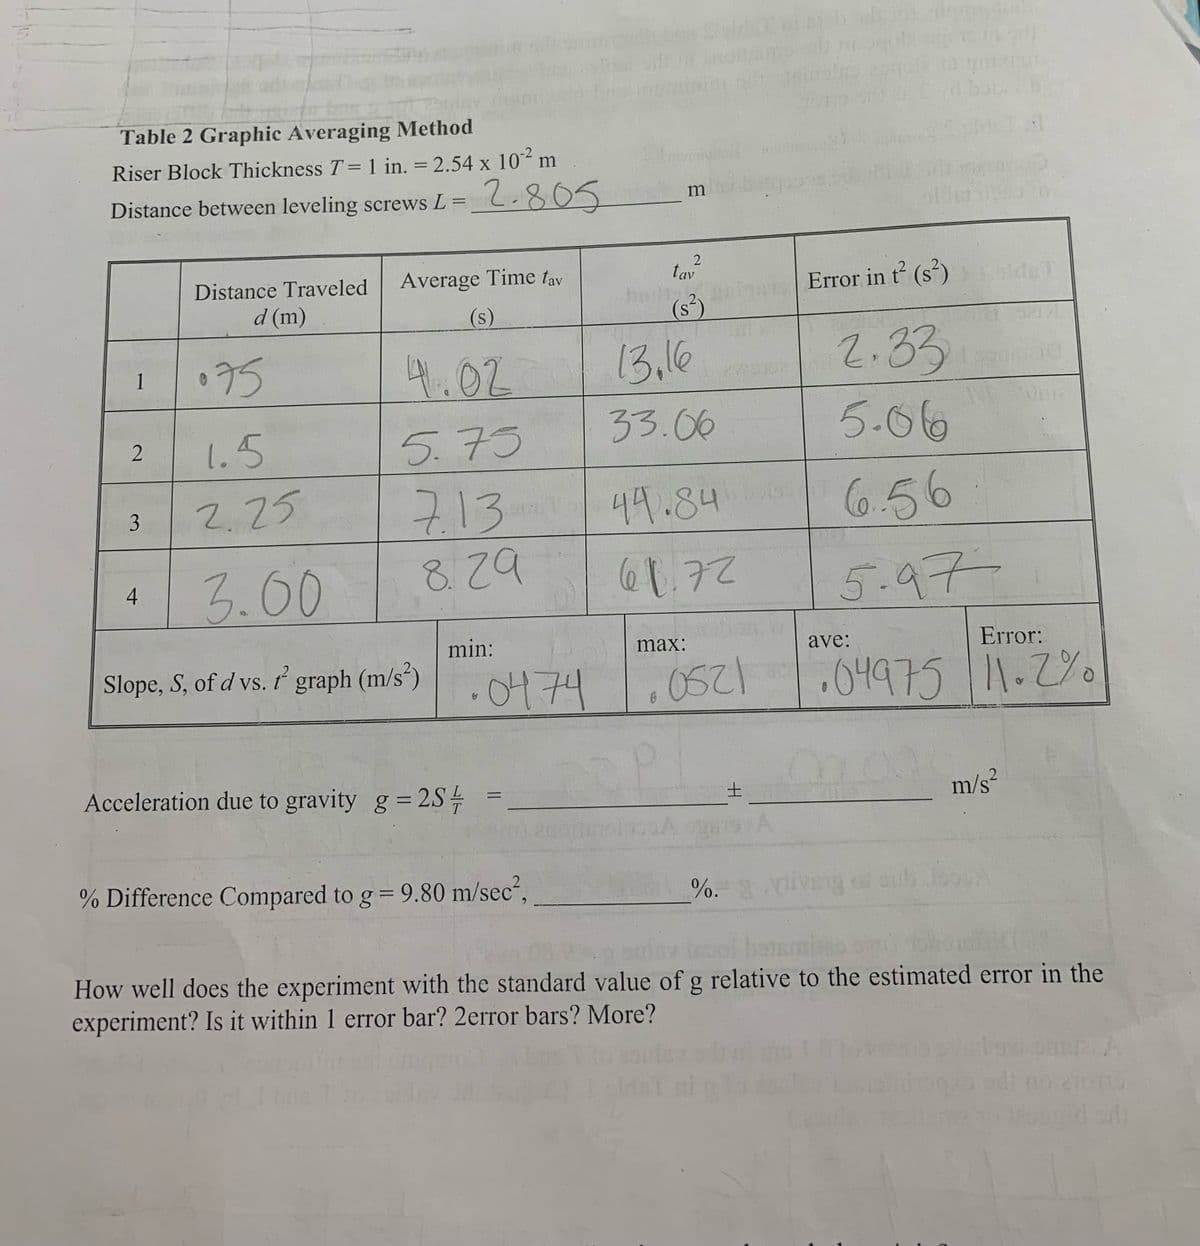
Transcribed Image Text:Table 2 Graphic Averaging Method
Riser Block Thickness T= 1 in. = 2.54 x 10 m
%3D
Distance between leveling screws L =
2.805
m
tav
bodty
(s³)
Distance Traveled
Average Time tay
Error in t (s) de
d (m)
(s)
う5
4.02
13,16
2.33
1
1.5
5.73
33.06
5.06
2.25
713
49.84
6.56
3.00
8.29
61.72
5.97-
min:
max:
ave:
Error:
Slope, S, of d vs. graph (m/s²)
.0474
.0521.04975 1.%
Acceleration due to gravity g = 2S
m/s?
土
%3D
%3D
% Difference Compared to g = 9.80 m/sec",
%. ivEg o oub book
How well does the experiment with the standard value of g relative to the estimated error in the
experiment? Is it within 1 error bar? 2error bars? More?
3.
4+
Expert Solution
This question has been solved!
Explore an expertly crafted, step-by-step solution for a thorough understanding of key concepts.

This is a popular solution!

Trending now
This is a popular solution!

Step by step
Solved in 3 steps

Recommended textbooks for you
Stars and Galaxies
Physics
ISBN:
9781305120785
Author:
Michael A. Seeds, Dana Backman
Publisher:
Cengage Learning

University Physics Volume 1
Physics
ISBN:
9781938168277
Author:
William Moebs, Samuel J. Ling, Jeff Sanny
Publisher:
OpenStax - Rice University
Stars and Galaxies
Physics
ISBN:
9781305120785
Author:
Michael A. Seeds, Dana Backman
Publisher:
Cengage Learning
University Physics Volume 1
Physics
ISBN:
9781938168277
Author:
William Moebs, Samuel J. Ling, Jeff Sanny
Publisher:
OpenStax - Rice University