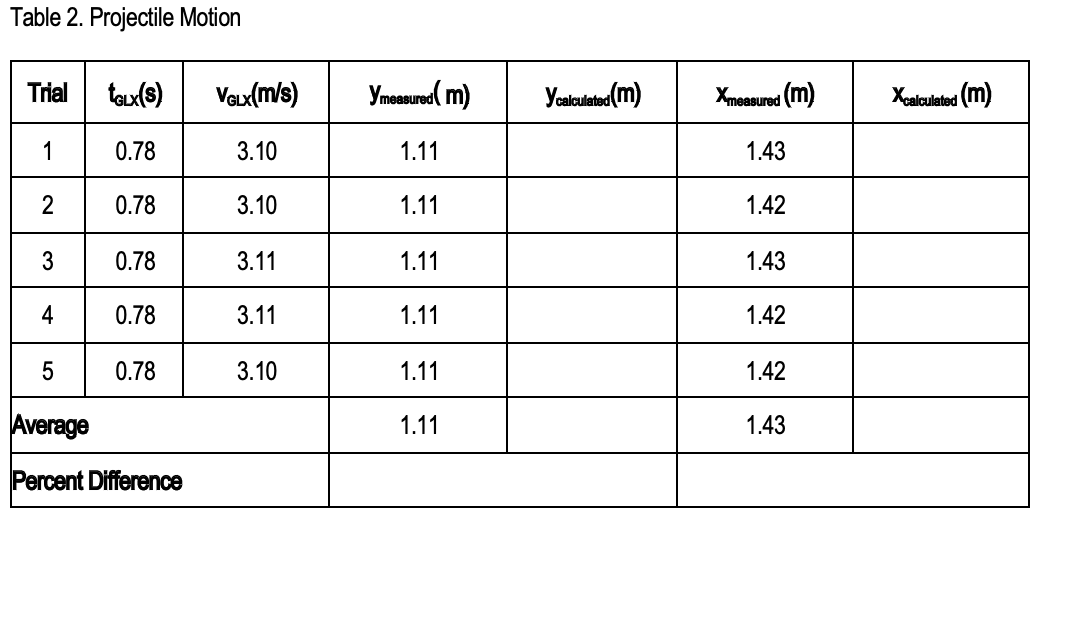
Table 2. Projectile Motion Trial tGLX(S) 0.78 0.78 0.78 0.78 0.78 1 2 3 4 5 Average Percent Difference VGLX(m/s) 3.10 3.10 3.11 3.11 3.10 Ymeasured (m) 1.11 1.11 1.11 1.11 1.11 1.11 y calculated (m) Xmeasured (m) 1.43 1.42 1.43 1.42 1.42 1.43 Xcalculated (m)

Q: 4a.2. Using the table of experimental values of carrier concentrations n for various metals,…
A: Disclaimer: “Since you have asked posted a question with multiple sub-parts, we will solve the first…
Q: is struck exactly at its midpoint causing a small displacement. Calculate how long it will take the…
A: Given: Mass of wire (m)=0.400kg Length(L)=0.640m Suspended block has mass (M) = 102kg Lets solve…
Q: A bicycle ramp forms a right triangle. One leg is 3 meters longer than the other leg. If a bicycle…
A: For a right triangle, ABC, if one arm AB = d ; another arm BC = h ; hypotenuse AC = s,…
Q: The Coulombic potential operator for the electron in the hydrogen atom is: V(r) = 4πer Calculate the…
A: Given that:V^=-e24πεorψ(r,θ,ϕ)=1πao3e-rao
Q: The intensity I of a progressive wave is related to pressure amplitude P by I = where Z is the…
A:
Q: 11. If f(x) = cosh-1(5x), then f'(x) = 5 1 B) 5 √25x²+1 √√25x²+1 D) √25x²-1 12. Let f(x) =…
A:
Q: 10. The resistance of 1.5 km of wire of cross-sectional area 0.17 mm² is 1500. Determine the…
A: Length of the wire, l=1.5 km = 1500m Cross sectional area of the wire, A = 0.17mm2= 0.17x10⁻⁶m…
Q: Examine the effect of symmetric T on the Hamiltonian of an e ormation g in the coulomb potentical.
A:
Q: Strontium-89 is a radioactive isotope of strontium, with symbol 38Sr. It decays via beta-minus decay…
A:
Q: Consider the simplified single-piston engine in the figure. Assuming the wheel has a radius A = 20.0…
A: Since we answer up to three subparts we will answer the first three. Please resubmit the question…
Q: C A+B+C =0 C=? m A 8=? 21° A = 80 m B = 105 m B 11 X N W to E
A:
Q: When a vector that has both nonzero magnitude and a direction is added to another vector whose…
A: All physical quantities are being classified as either scalar quantity or vectors. A quantity is…
Q: 1. Using the definition of the dot product A B = A1B₁ + A2B2 + A3B3, prove that a) AB=BA; b) A.…
A:
Q: Q.4 (b) In a scintillation detector, the 662 KeV photo peak of Cs137 source is observed at 6.0 V and…
A:
Q: If you look into the bowl of a metal spoon, you see yourself up- side down. Flip the spoon so you're…
A: Spoons are made of silver or stainless steel. They are very shiny and are capable of acting like a…
Q: please write properly the solution, it's hard to understand
A: Given:- initial speed of 20 m/s final speed of 35 m/s. Time taken in changing speed…
Q: 3a.3. Consider a longitudinal wave us propagating in a linear monoatomic chain of mass M and with…
A:
Q: Q6) Two quantities are measured with uncertainties, as follows: r = 5.6 ± 0.3 Calculate the values…
A: Since you have posted a question with multiple sub-parts, we will solve the first three sub-parts…
Q: moving n one dimension in a region where the psoiton depend potential energy is U(x) and prove dt =…
A:
Q: The state u,> U₂ and complete set of orthogonal basis for a givne system. The state ₁ and 2 > are…
A:
Q: The charges and coordinates of two charged particles held fixed in an xy plane are q₁-3.26 µC,…
A:
Q: Problem 3. In Introductory Mechanics, you learned about simple harmonic oscillators. One such system…
A:
Q: Q6. For a SDOF system, m=50kg, k=20kN/m, c=3kNs/m. The system has an initial velocity of 150mm/s and…
A: Given that: m=50 kgk=20 kN/m=20000 N/mc=3 kNs/m=3000 Ns/mx(0)=0v(0)=150 mm/s=0.150 m/s
Q: Potassium chloride (KCl) is an ionic solid with a crystalline structure whose planes are 0.314 nm…
A: Given that:Interplaner spacing, d=0.324 nmWavelength, λ=0.267 nmOrder of diffraction, n=1
Q: An astronaut is performing repairs on the outside of the International Space station. (a) The…
A: Given that:a) Torque, T=7.0 NmMaximum force, Fmax=21 N
Q: 2. Two positive sign charges are separated by a distance r and have a field E on each other. a. If r…
A: Electric field at a point is defined as electrostatic force acting on a unit positive test charge…
Q: Question 2. aican Crotosd2.08.2iayd9 Two carts, travelling at the same initial speed, move toward…
A: We have given that the initial speed of the both carts is same. They move toward each other. The…
Q: Q2) Calculate the force the biceps muscle must exert to hold the forearm and its load as shown in…
A: The free body diagram is shown below There are four forces acting on the arm, the force of the…
Q: 4. A photon passes through a horizontal slit of width 5 x 10⁻⁶ m. What uncertainty in the vertical…
A: Note: We’ll answer the first question since the exact one wasn’t specified. Please submit a new…
Q: A) -3.7 V B C D What is the peak output voltage during negative cycle? -11.3 V -2.7 V 15 V -12 V 0…
A:
Q: 2. (a) Find the resultant of these three forces in vector form. (b) Find the magnitude of part (a) 2…
A:
Q: A small projectile is fired vertically downward into a fluid medium with an initial velocity of 60…
A:
Q: Define the unitary porperty of time evolution
A:
Q: 6. An object travels along a straight path. So = 0, vo = 10m/s and to = 0. Its acceleration (in…
A: Given: s0 = 0 m t0 = 0 sec v0 = 10 m/s We have to find the time taken to reach s = 600 m
Q: 128. A sine wave has a frequency of 50 Hz. Its angular frequency will be A. 50 radians/sec B. 50 n…
A: Given data, Frequency f = 50 Hz.
Q: What 3 subatomic particles are found in an atom and where? What are the charges for each of these?
A: A subatomic particle is a particle that composes an atom.
Q: 2. Ana runs 4 m, 40° North of East; 2 m, East; 5.2 m 30° South of West; and 6.5 m, South before…
A: 2)
Q: Consider a container filled with helium gas at room temperature and ambient pressure. (a) Sketch a…
A:
Q: Question No.13: A cop fires a bullet at an angle of 30° (upward from the horizontal) from his…
A:
Q: If a car has a suspension system with a force constant of 5.00 x 10⁴ N/m, how much energy must the…
A:
Q: Show that the curl of the curl of E is equal to, V(V.E) - V²E
A:
Q: Borges Machine Shop, Inc., has a 1-year contract for the production of 225,000 gear housings for a…
A:
Q: Find the following for path B in the figure below. A 0 C 2 6 8 10 12 displacement x (m) 4 (a) the…
A: Distance travelled is the total distance travelled between any two points, while displacement is the…
Q: Explain how Kinematics can be applied to the field of Medical and Health Sciences. Give at least 3…
A: In kinematics, forces and potential fields are not directly considered when describing the motion of…
Q: 1. A steel wire of mass 0.400 kg and length 0.640 m supports a 102-kg block. The wire is struck…
A: We have following values-Mass of the wire, m=0.4 kgLength, L= 0.640 mMass of the suspended block, M=…
Q: 4. The three symbols x,va have eight possible combinations of signs a. Draw a four-dot motion…
A: Considering 1D motion, we know that if acceleration is in direction of motion, the velocity…
Q: Starting from rest at home plate, a baseball player runs to first base (90 ft away). He uniformly…
A:
Q: A fireworks show is choreographed to have two shells cross paths at a height of 142 feet and explode…
A: We are given the maximum height of both projectiles. We know that maximum height of projectile is…
Q: You are pulling a mass down a slope at a constant speed with a cable. If the mass is 100 kg, the…
A: Given: The mass is 100 kg. The angle made by the slope is 5°. The coefficient…
Q: Q5. Consider a mono-static RADAR with the following parameters: f-10 GHz Transmitter frequency, the…
A: The given parameters are, Transmitted signal, Pt = 400 kW Transmitter frequency, f = 10 GHz Radar…
Good day! May I ask What is the needed Interpretation of these data? Thank you!
Angle: 55 degrees

Step by step
Solved in 3 steps with 2 images
