Table 5.1: Output Growth and Inflation Forecastsla) Per cent Year-ended Dec 2019 Jun 2020 Dec 2020 Jun 2021 Dec 2021 Jun 2022 GDP growth 2 2 24 3 3 (previous) (24) (22) (24) (3) (3) (n/a) Unemployment rate(b) 5.2 5 44 44 (previous) (5%) (5%) (5%) (5) (5) (n/a) CPI inflation 1.8 14 14 2 2 (previous) (14) (2) (1%) (14) (2) (n/a) Trimmed mean inflation 1.6 14 14 2 2 (previous) (12) (14) (14) (14) (2) (n/a) Year-average 2019 2019/20 2020 2020/21 2021 2021/22 GDP growth 14 2 24 24 3 3 (previous) (1%) (24) (2%) (24) (3) (n/a) (a) Technical assumptions include the cash rate moving in line with market pricing, TWI at 58, A$ at US$0.67 and Brent crude oil price at US$54 per barrel; shaded regions are historical data; figures in parentheses show the corresponding forecasts in the November 2019 Statement on Monetary Policy (b) Average rate in the quarter Sources: ABS; RBA Table 6.1: Output Growth and Inflation Baseline Forecasts(a),(b) Per cent Year-ended Jun 2020 Dec 2020 Jun 2021 Dec 2021 Jun 2022 Dec 2022 GDP growth -6 -6 4 5 4 4 (previous) (-8) (-6) (7) (6) (5) (n/a) Unemployment ratel 7.0 10 82 (previous) (10) (9) (8%) (7%) (6%) (n/a) CPI inflation -0.3 3 1 (previous) (-1) (4) (2%) (14) (1%) (n/a) Trimmed mean inflation 1.2 1 1 14 (previous) (12) (14) (14) (14) (1%) (n/a) Year-average 2019/20 2020 2020/21 2021 2021/22 2022 GDP growth 4 -3 2 5 4 (previous) (-1) (-5) (-3) (4) (6) (n/a) (a) Forecast assumptions (May Statement in parenthesis): TWI at 61 (57), AS at US$0.72 (US$0.64), Brent crude oil price at US$46/bbl (US$35/bb); the cash rate remains at ts current level and other elements of the Bank's monetary stimulus package, indluding the 0.25 per cent target for the 3-year Australian Government bond yield, are assumed to remain unchanged. (b) Rounding varies: GDP growth to the nearest whole number; unemployment rate to the nearest half point; inflation rates to the nearest quarter point. Shaded regions are historical data. Figures in parentheses show the corresponding baseline scenario forecasts in the May 2020 Statement. (C) Average rate in the quarter Sources: ABS; RBA From 2008 until 2019, the average GDP growth rate has been approximately 2.5% and inflation has been approximately 2.1%.
Table 5.1: Output Growth and Inflation Forecastsla) Per cent Year-ended Dec 2019 Jun 2020 Dec 2020 Jun 2021 Dec 2021 Jun 2022 GDP growth 2 2 24 3 3 (previous) (24) (22) (24) (3) (3) (n/a) Unemployment rate(b) 5.2 5 44 44 (previous) (5%) (5%) (5%) (5) (5) (n/a) CPI inflation 1.8 14 14 2 2 (previous) (14) (2) (1%) (14) (2) (n/a) Trimmed mean inflation 1.6 14 14 2 2 (previous) (12) (14) (14) (14) (2) (n/a) Year-average 2019 2019/20 2020 2020/21 2021 2021/22 GDP growth 14 2 24 24 3 3 (previous) (1%) (24) (2%) (24) (3) (n/a) (a) Technical assumptions include the cash rate moving in line with market pricing, TWI at 58, A$ at US$0.67 and Brent crude oil price at US$54 per barrel; shaded regions are historical data; figures in parentheses show the corresponding forecasts in the November 2019 Statement on Monetary Policy (b) Average rate in the quarter Sources: ABS; RBA Table 6.1: Output Growth and Inflation Baseline Forecasts(a),(b) Per cent Year-ended Jun 2020 Dec 2020 Jun 2021 Dec 2021 Jun 2022 Dec 2022 GDP growth -6 -6 4 5 4 4 (previous) (-8) (-6) (7) (6) (5) (n/a) Unemployment ratel 7.0 10 82 (previous) (10) (9) (8%) (7%) (6%) (n/a) CPI inflation -0.3 3 1 (previous) (-1) (4) (2%) (14) (1%) (n/a) Trimmed mean inflation 1.2 1 1 14 (previous) (12) (14) (14) (14) (1%) (n/a) Year-average 2019/20 2020 2020/21 2021 2021/22 2022 GDP growth 4 -3 2 5 4 (previous) (-1) (-5) (-3) (4) (6) (n/a) (a) Forecast assumptions (May Statement in parenthesis): TWI at 61 (57), AS at US$0.72 (US$0.64), Brent crude oil price at US$46/bbl (US$35/bb); the cash rate remains at ts current level and other elements of the Bank's monetary stimulus package, indluding the 0.25 per cent target for the 3-year Australian Government bond yield, are assumed to remain unchanged. (b) Rounding varies: GDP growth to the nearest whole number; unemployment rate to the nearest half point; inflation rates to the nearest quarter point. Shaded regions are historical data. Figures in parentheses show the corresponding baseline scenario forecasts in the May 2020 Statement. (C) Average rate in the quarter Sources: ABS; RBA From 2008 until 2019, the average GDP growth rate has been approximately 2.5% and inflation has been approximately 2.1%.

Essentials of Economics (MindTap Course List)
8th Edition
ISBN:9781337091992
Author:N. Gregory Mankiw
Publisher:N. Gregory Mankiw
Chapter20: Unemployment
Section: Chapter Questions
Problem 1CQQ

Related questions
Question
a) Explain with reference to the
b) Suppose that new data comes in after August 2020 that is better than the forecasts. Explain how the RBA adjusts the target cash rate and explain why they would make this change.
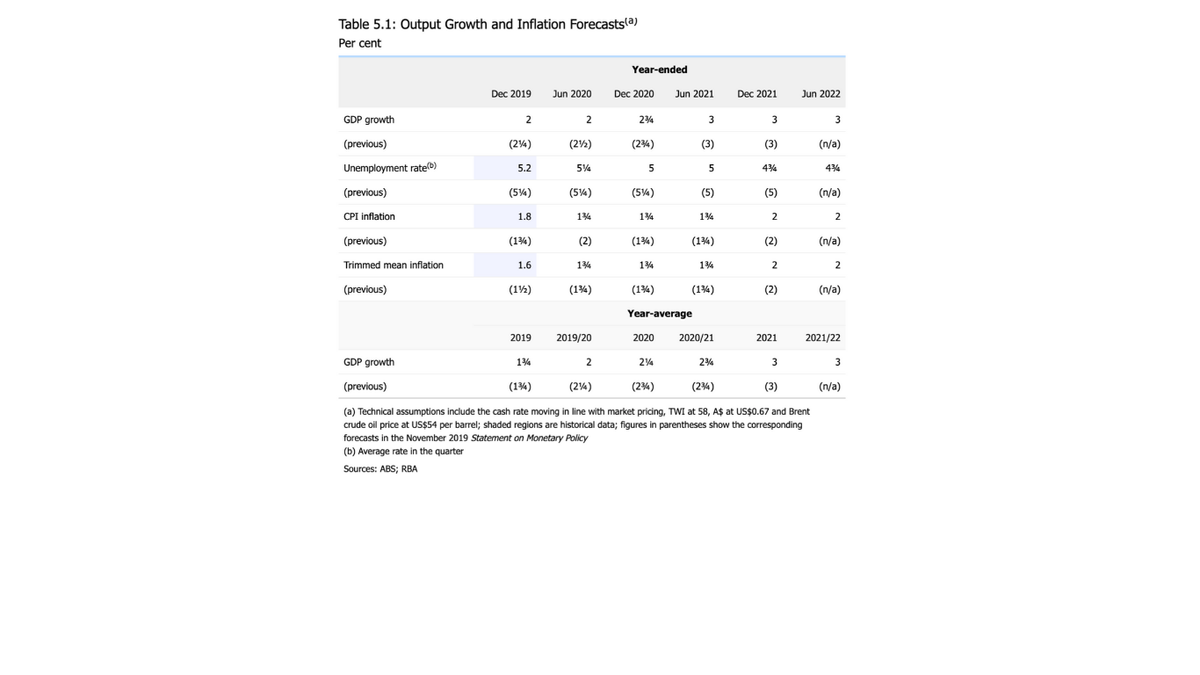
Transcribed Image Text:Table 5.1: Output Growth and Inflation Forecastsla)
Per cent
Year-ended
Dec 2019
Jun 2020
Dec 2020
Jun 2021
Dec 2021
Jun 2022
GDP growth
2
2
24
3
3
(previous)
(24)
(22)
(24)
(3)
(3)
(n/a)
Unemployment rate(b)
5.2
5
44
44
(previous)
(5%)
(5%)
(5%)
(5)
(5)
(n/a)
CPI inflation
1.8
14
14
2
2
(previous)
(14)
(2)
(1%)
(14)
(2)
(n/a)
Trimmed mean inflation
1.6
14
14
2
2
(previous)
(12)
(14)
(14)
(14)
(2)
(n/a)
Year-average
2019
2019/20
2020
2020/21
2021
2021/22
GDP growth
14
2
24
24
3
3
(previous)
(1%)
(24)
(2%)
(24)
(3)
(n/a)
(a) Technical assumptions include the cash rate moving in line with market pricing, TWI at 58, A$ at US$0.67 and Brent
crude oil price at US$54 per barrel; shaded regions are historical data; figures in parentheses show the corresponding
forecasts in the November 2019 Statement on Monetary Policy
(b) Average rate in the quarter
Sources: ABS; RBA
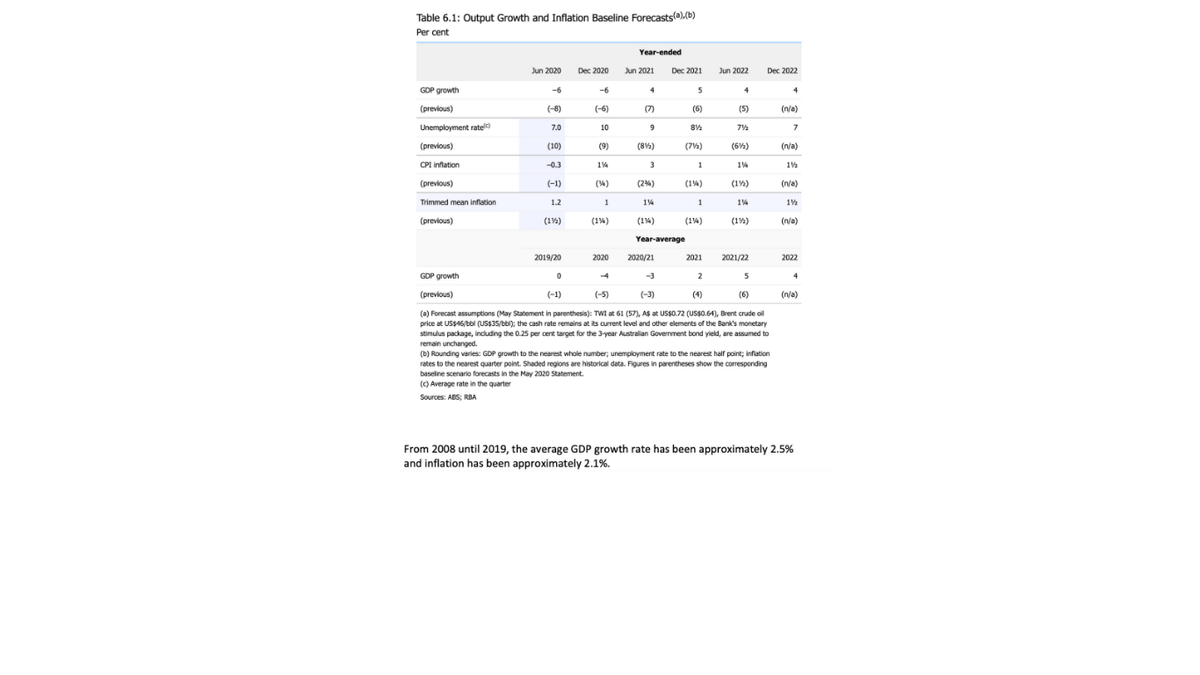
Transcribed Image Text:Table 6.1: Output Growth and Inflation Baseline Forecasts(a),(b)
Per cent
Year-ended
Jun 2020
Dec 2020
Jun 2021
Dec 2021
Jun 2022
Dec 2022
GDP growth
-6
-6
4
5
4
4
(previous)
(-8)
(-6)
(7)
(6)
(5)
(n/a)
Unemployment ratel
7.0
10
82
(previous)
(10)
(9)
(8%)
(7%)
(6%)
(n/a)
CPI inflation
-0.3
3
1
(previous)
(-1)
(4)
(2%)
(14)
(1%)
(n/a)
Trimmed mean inflation
1.2
1
1
14
(previous)
(12)
(14)
(14)
(14)
(1%)
(n/a)
Year-average
2019/20
2020
2020/21
2021
2021/22
2022
GDP growth
4
-3
2
5
4
(previous)
(-1)
(-5)
(-3)
(4)
(6)
(n/a)
(a) Forecast assumptions (May Statement in parenthesis): TWI at 61 (57), AS at US$0.72 (US$0.64), Brent crude oil
price at US$46/bbl (US$35/bb); the cash rate remains at ts current level and other elements of the Bank's monetary
stimulus package, indluding the 0.25 per cent target for the 3-year Australian Government bond yield, are assumed to
remain unchanged.
(b) Rounding varies: GDP growth to the nearest whole number; unemployment rate to the nearest half point; inflation
rates to the nearest quarter point. Shaded regions are historical data. Figures in parentheses show the corresponding
baseline scenario forecasts in the May 2020 Statement.
(C) Average rate in the quarter
Sources: ABS; RBA
From 2008 until 2019, the average GDP growth rate has been approximately 2.5%
and inflation has been approximately 2.1%.
Expert Solution
This question has been solved!
Explore an expertly crafted, step-by-step solution for a thorough understanding of key concepts.

Step by step
Solved in 2 steps

Knowledge Booster


Learn more about
Need a deep-dive on the concept behind this application? Look no further. Learn more about this topic, economics and related others by exploring similar questions and additional content below.Recommended textbooks for you
Essentials of Economics (MindTap Course List)
Economics
ISBN:
9781337091992
Author:
N. Gregory Mankiw
Publisher:
Cengage Learning

Brief Principles of Macroeconomics (MindTap Cours…
Economics
ISBN:
9781337091985
Author:
N. Gregory Mankiw
Publisher:
Cengage Learning

Principles of Economics, 7th Edition (MindTap Cou…
Economics
ISBN:
9781285165875
Author:
N. Gregory Mankiw
Publisher:
Cengage Learning
Essentials of Economics (MindTap Course List)
Economics
ISBN:
9781337091992
Author:
N. Gregory Mankiw
Publisher:
Cengage Learning
Brief Principles of Macroeconomics (MindTap Cours…
Economics
ISBN:
9781337091985
Author:
N. Gregory Mankiw
Publisher:
Cengage Learning
Principles of Economics, 7th Edition (MindTap Cou…
Economics
ISBN:
9781285165875
Author:
N. Gregory Mankiw
Publisher:
Cengage Learning

Principles of Macroeconomics (MindTap Course List)
Economics
ISBN:
9781305971509
Author:
N. Gregory Mankiw
Publisher:
Cengage Learning

Principles of Economics (MindTap Course List)
Economics
ISBN:
9781305585126
Author:
N. Gregory Mankiw
Publisher:
Cengage Learning

Principles of Macroeconomics (MindTap Course List)
Economics
ISBN:
9781285165912
Author:
N. Gregory Mankiw
Publisher:
Cengage Learning