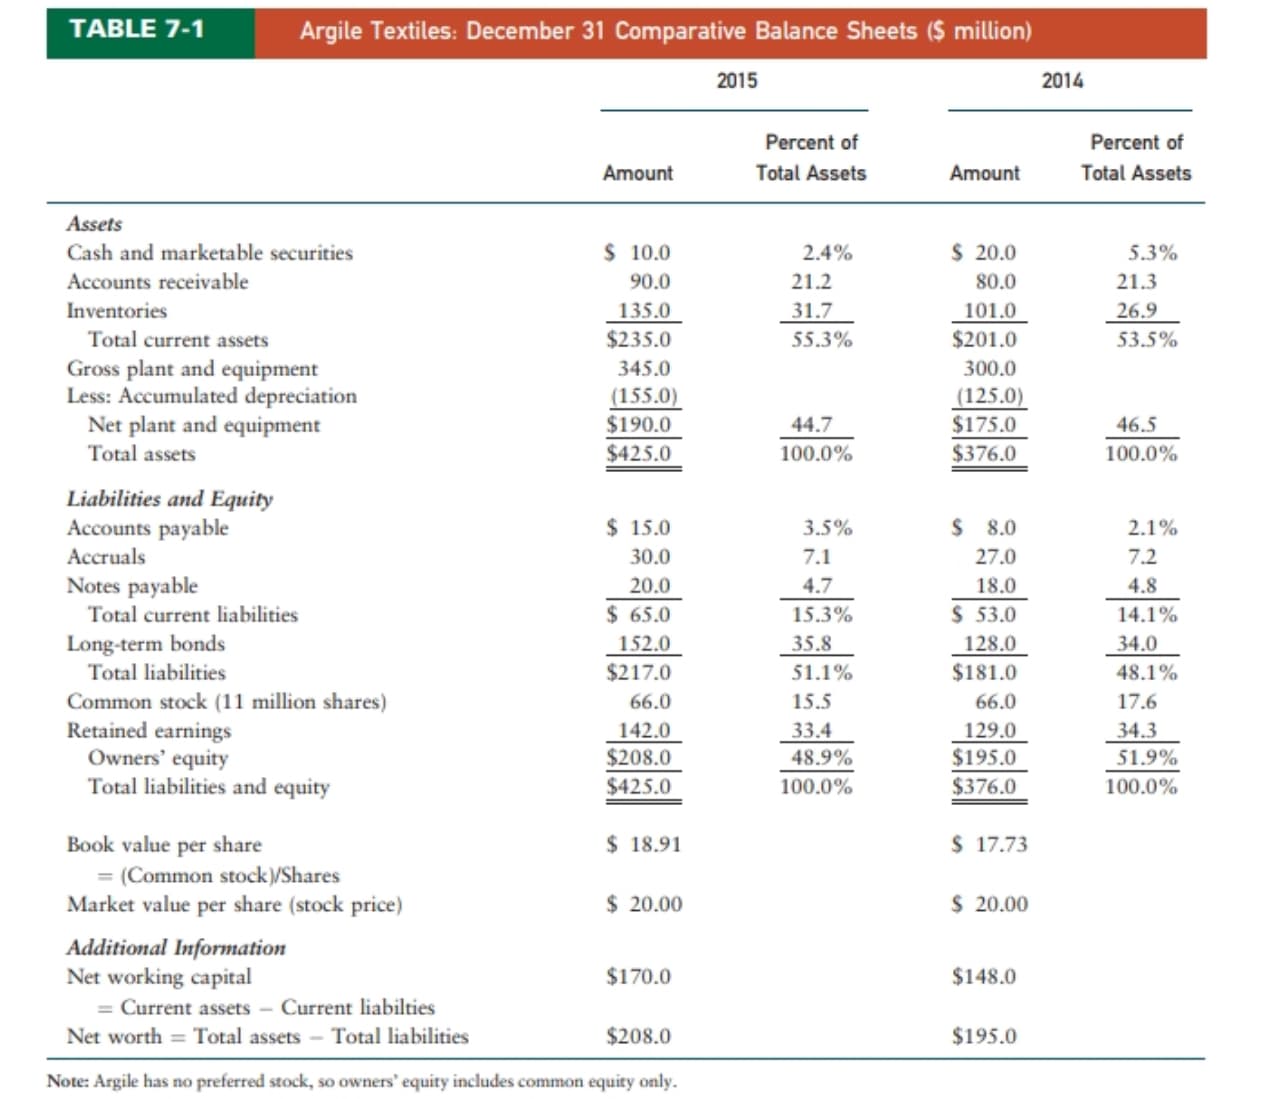
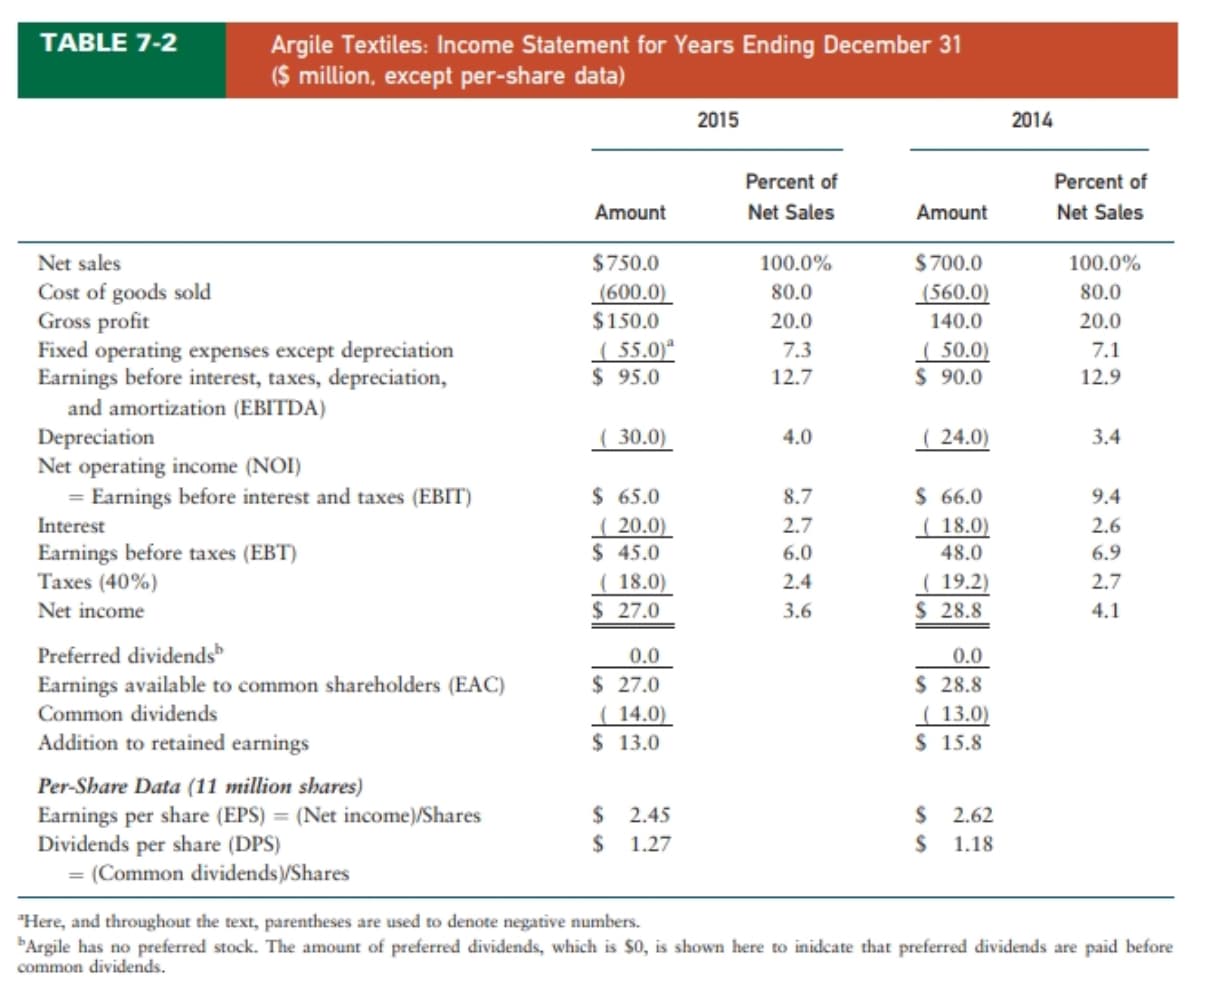
TABLE 7-1 Argile Textiles: December 31 Comparative Balance Sheets ($ million) 2015 2014 Percent of Percent of Amount Total Assets Amount Total Assets Assets Cash and marketable securities $ 10.0 2.4% $ 20.0 5.3% Accounts receivable 90.0 21.2 80.0 21.3 Inventories 135.0 31.7 101.0 26.9 Total current assets $235.0 55.3% $201.0 53.5% Gross plant and equipment Less: Accumulated depreciation Net plant and equipment Total assets 345.0 300.0 (155.0) $190.0 (125.0) $175.0 44.7 46.5 $425.0 100.0% $376.0 100.0% Liabilities and Equity Accounts payable $ 15.0 3.5% $ 8.0 2.1% Accruals 30.0 7.1 27.0 7.2 Notes payable Total current liabilities 20.0 4.7 18.0 4.8 $ 65.0 152.0 $217.0 15.3% $ 53.0 14.1% Long-term bonds Total liabilities 35.8 128.0 $181.0 34.0 51.1% 48.1% Common stock (11 million shares) Retained earnings Owners' equity Total liabilities and equity 66.0 15.5 66.0 17.6 142.0 33.4 129.0 34.3 $208.0 48.9% $195.0 51.9% $425.0 100.0% $376.0 100.0% Book value per share $ 18.91 $ 17.73 = (Common stock)/Shares Market value per share (stock price) $ 20.00 $ 20.00 Additional Information Net working capital = Current assets - Current liabilties $170.0 $148.0 Net worth = Total assets - Total liabilities $208.0 $195.0 Note: Argile has no preferred stock, so owners' equity includes common equity only. TABLE 7-2 Argile Textiles: Income Statement for Years Ending December 31 ($ million, except per-share data) 2015 2014 Percent of Percent of Amount Net Sales Amount Net Sales Net sales $750.0 100.0% $700.0 100.0% Cost of goods sold Gross profit Fixed operating expenses except depreciation Earnings before interest, taxes, depreciation, 80.0 (560.0) 80.0 (600.0) $150.0 20.0 140.0 20.0 ( 55.0)ª $ 95.0 ( 50.0) $ 90.0 7.3 7.1 12.7 12.9 and amortization (EBITDA) ( 24.0) Depreciation Net operating income (NOI) = Earnings before interest and taxes (EBIT) _( 30.0) 4.0 3.4 $ 65.0 ( 20.0) $ 45.0 ( 18.0) $ 27.0 8.7 $ 66.0 9.4 Interest 2.7 ( 18.0) 2.6 Earnings before taxes (EBT) Taxes (40%) 6.0 48.0 6.9 ( 19.2) $ 28.8 2.4 2.7 Net income 3.6 4.1 Preferred dividends 0.0 0.0 $ 27.0 ( 14.0) $ 13.0 Earnings available to common shareholders (EAC) $ 28.8 ( 13.0) $ 15.8 Common dividends Addition to retained earnings Per-Share Data (11 million shares) Earnings per share (EPS) = (Net income)/Shares Dividends per share (DPS) = (Common dividends)/Shares $ 2.45 $ 2.62 1.27 1.18 "Here, and throughout the text, parentheses are used to denote negative numbers. Argile has no preferred stock. The amount of preferred dividends, which is $0, is shown here to inidcate that preferred dividends are paid before common dividends.


7-12) Data for Argils Textiles' 2014 financial statements are given in Tables 7.1 and 7.2 in the chapter.
a) Compute the 2014 values of the following ratios:
|
2014 Values |
||
|
Ratio |
Argile |
Industry |
|
Current ratio |
3.9x |
|
|
Days sales outstanding |
33.5 days |
|
|
Inventory turnover |
7.2x |
|
|
Fixed assets turnover |
4.1x |
|
|
Debt ratio |
43.0% |
|
|
Net profit margin |
4.6% |
|
|
|
9.9% |
b) Briefly comment on Argile’s 2014 financial position. Can you see any obvious strengths or weaknesses?
c) Compare Argile’s 2014 ratios with its 2015 ratios, which are presented in Table 7-6. Comment on whether you believe Argile’s fincial position improved or deteriorated during 2015.
|
TABLE 7-6: Argile Textiles: Summary of 2015 Financial Ratios ($ million, except per-share dollars) |
|||||||||
|
Ratio |
Formula for Calculation |
Computation |
Ratio Value |
Industry Average |
Comment |
||||
|
Liquity |
|||||||||
|
Current |
= Current assets__ Current liabilities |
$235.0 $65.0 |
= |
3.6x |
4.1x |
Low |
|||
|
Quick, or acid test |
= Current assets – Inventory Current liabilities |
$100.0 $65.0 |
= |
1.5x |
2.1x |
Low |
|||
|
Asset Management Inventory turnover |
= Cost of goods sold Inventory |
$600.0 $135.0 |
= |
4.4x |
7.4x |
Low |
|||
|
Days sales out- standing (DSO) |
= Accounts receivable |
$90.0 $2.08 |
= |
43.2 days |
32.1 days |
Poor |
|||
|
Fixed assets turnover |
= ___Sales_______ Net fixed assets |
$750.0 $190.0 |
= |
3.9x |
4.0x |
OK |
|||
|
Total assets turnover |
= Sales Total assets |
$750.0 $425.0 |
= |
1.8x |
2.1x |
Low |
|||
|
Debt Management Debt-to-total-assets |
= Total liabilities Total assets |
$217.0 $425.0 |
= |
51.1% |
42.0% |
Poor |
|||
|
Times interest earned (TIE) |
= EBIT________ Interest charges |
$65.0 $20.0 |
= |
3.3x |
6.5x |
Low |
|||
|
Fixed charge coverage |
= ____EBIT+ Lease payments Interest Lease Sinking fund payments charges + payments + (1 – Tax rate) |
$70.0 $31.7 |
= |
2.2x |
5.8x |
Low |
|||
|
Profitability Net profit margin |
= Net income Sales |
$27.0 $750.0 |
= |
3.6% |
4.9% |
Poor |
|||
|
Return on total Assets (ROA) |
= Net income Total assets |
$27.0 $425.0 |
= |
6.4% |
11.5% |
Poor |
|||
|
Return of equity ( |
=Net income available to common stockholders Common equity |
$27.0 $208.0 |
= |
13.0% |
$17.7 |
Poor |
|||
|
Market Value Price/Earnings(P/E) |
=Market price per share Earnings per share |
$20.00 $2.45 |
= |
8.2x |
15.0x |
Low |
|||
|
Market/Book (M/B) |
=Market price per share Book value per share |
$20.00 $18.91 |
= |
1.1x |
2.2x |
Low |
d) What other information would be useful for projecting whether Argile’s financial position is expected to improve or deteriorate in the future?


Trending now
This is a popular solution!

Step by step
Solved in 4 steps with 10 images


