TABLE B Random digits Line 101 102 19223 73676 95034 47150 05756 99400 28713 01927 96409 27754 12531 42648 42544 82425 82853 36290 90056 103 45467 71709 77558 00095 60227 91481 32863 29485 85848 53791 82226 104 105 52711 95592 38889 94007 93074 69971 40011 60779 48767 17297 52573 59335 106 107 35013 57890 72024 15529 20807 68417 72765 47511 85089 57067 55300 50211 47487 82739 60940 36009 81676 61790 94383 87964 83485 76688 14893 18883 108 17868 24943 39638 24697 90656 46816 42006 41979 08708 39950 45785 109 19365 48789 15412 110 111 112 38448 81486 59636 18338 60513 04634 85453 39364 00412 19352 69487 88804 09297 71197 71238 73089 27649 84898 113 62568 45149 61041 70206 40325 75730 94322 03699 71080 22553 11486 11776 70915 32592 114 32992 77684 66280 24709 03819 56202 14526 115 116 117 02938 31893 50490 41448 73698 14459 26056 31424 62183 80371 38167 73190 65103 23417 84407 62253 26185 61181 75532 98532 32533 07118 55972 70632 29669 118 119 120 04470 90785 65956 98624 43742 86382 84826 11937 95857 35476 71487 13873 87664 39421 92099 58806 04266 66979 35435 121 122 09984 81598 29077 95052 65850 14863 90908 61683 73592 47052 75186 62224 51025 95761 87136 41842 27611 62103 48409 85117 123 54580 81507 27102 56027 55892 33063 81868 71035 96746 124 09001 12149 43367 37823 49497 71868 72719 18442 96758 35119 91596 39244 125 126 127 96927 43909 19931 99477 14227 36089 25330 74192 64359 14374 77567 40085 88741 16925 41903 36071 87209 128 15689 06565 13352 49367 54303 06489 81982 36759 69051 05007 68732 129 130 58984 64817 68288 87174 22913 09517 18638 84534 00795 87201 08727 97245 131 132 16632 55259 81194 84292 14873 08796 04197 43165 85576 93739 45195 96565 97150 31685 18132 133 45740 41807 78416 55658 65561 33302 07051 93623 09547 134 27816 18329 39100 21337 78458 35213 11206 37741 04312 87151 68508 31260 135 136 137 66925 08421 53645 19876 08563 44753 77377 28744 47836 75592 12609 79140 98481 92454 14592 61421 15373 33586 66812 138 139 140 66831 55588 68908 99404 40772 21558 41098 45144 47781 43563 72321 79177 70708 13048 23822 06928 51719 02428 56934 81940 48394 00360 12975 96767 72829 13258 35964 50232 141 96012 63408 94591 77919 65194 44575 50842 24870 53372 04178 142 97892 193 194 60313 52884 37569 85187 44692 50706 53161 69ô27 88389 56680 79003 23361 67094 15019 63261 24543
TABLE B Random digits Line 101 102 19223 73676 95034 47150 05756 99400 28713 01927 96409 27754 12531 42648 42544 82425 82853 36290 90056 103 45467 71709 77558 00095 60227 91481 32863 29485 85848 53791 82226 104 105 52711 95592 38889 94007 93074 69971 40011 60779 48767 17297 52573 59335 106 107 35013 57890 72024 15529 20807 68417 72765 47511 85089 57067 55300 50211 47487 82739 60940 36009 81676 61790 94383 87964 83485 76688 14893 18883 108 17868 24943 39638 24697 90656 46816 42006 41979 08708 39950 45785 109 19365 48789 15412 110 111 112 38448 81486 59636 18338 60513 04634 85453 39364 00412 19352 69487 88804 09297 71197 71238 73089 27649 84898 113 62568 45149 61041 70206 40325 75730 94322 03699 71080 22553 11486 11776 70915 32592 114 32992 77684 66280 24709 03819 56202 14526 115 116 117 02938 31893 50490 41448 73698 14459 26056 31424 62183 80371 38167 73190 65103 23417 84407 62253 26185 61181 75532 98532 32533 07118 55972 70632 29669 118 119 120 04470 90785 65956 98624 43742 86382 84826 11937 95857 35476 71487 13873 87664 39421 92099 58806 04266 66979 35435 121 122 09984 81598 29077 95052 65850 14863 90908 61683 73592 47052 75186 62224 51025 95761 87136 41842 27611 62103 48409 85117 123 54580 81507 27102 56027 55892 33063 81868 71035 96746 124 09001 12149 43367 37823 49497 71868 72719 18442 96758 35119 91596 39244 125 126 127 96927 43909 19931 99477 14227 36089 25330 74192 64359 14374 77567 40085 88741 16925 41903 36071 87209 128 15689 06565 13352 49367 54303 06489 81982 36759 69051 05007 68732 129 130 58984 64817 68288 87174 22913 09517 18638 84534 00795 87201 08727 97245 131 132 16632 55259 81194 84292 14873 08796 04197 43165 85576 93739 45195 96565 97150 31685 18132 133 45740 41807 78416 55658 65561 33302 07051 93623 09547 134 27816 18329 39100 21337 78458 35213 11206 37741 04312 87151 68508 31260 135 136 137 66925 08421 53645 19876 08563 44753 77377 28744 47836 75592 12609 79140 98481 92454 14592 61421 15373 33586 66812 138 139 140 66831 55588 68908 99404 40772 21558 41098 45144 47781 43563 72321 79177 70708 13048 23822 06928 51719 02428 56934 81940 48394 00360 12975 96767 72829 13258 35964 50232 141 96012 63408 94591 77919 65194 44575 50842 24870 53372 04178 142 97892 193 194 60313 52884 37569 85187 44692 50706 53161 69ô27 88389 56680 79003 23361 67094 15019 63261 24543

Functions and Change: A Modeling Approach to College Algebra (MindTap Course List)
6th Edition
ISBN:9781337111348
Author:Bruce Crauder, Benny Evans, Alan Noell
Publisher:Bruce Crauder, Benny Evans, Alan Noell
Chapter5: A Survey Of Other Common Functions
Section5.3: Modeling Data With Power Functions
Problem 6E: Urban Travel Times Population of cities and driving times are related, as shown in the accompanying...

Related questions
Question
100%
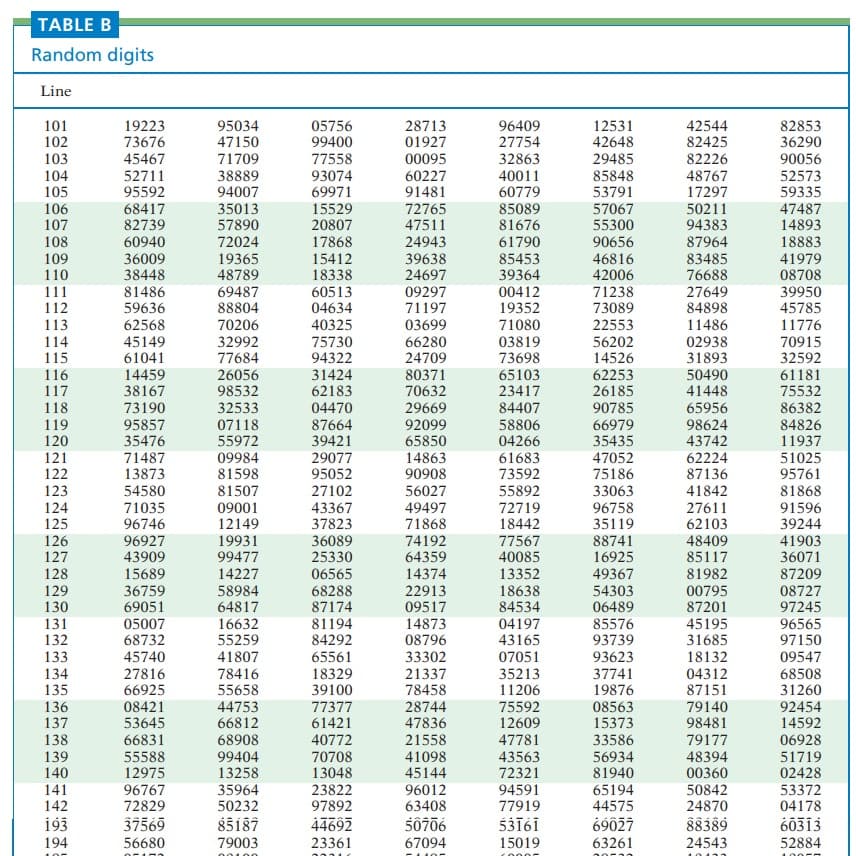
Transcribed Image Text:TABLE B
Random digits
Line
101
102
19223
73676
95034
47150
05756
99400
28713
01927
96409
27754
12531
42648
42544
82425
82853
36290
90056
103
45467
71709
77558
00095
60227
91481
32863
29485
82226
104
105
52711
95592
38889
94007
93074
69971
40011
60779
85848
53791
48767
52573
59335
106
107
15529
20807
17297
50211
94383
68417
35013
57890
72024
72765
47511
85089
81676
57067
55300
47487
82739
60940
36009
14893
18883
108
17868
24943
39638
24697
61790
90656
87964
46816
42006
71238
73089
41979
08708
39950
45785
109
19365
48789
15412
85453
39364
00412
19352
83485
76688
110
38448
81486
59636
69487
88804
18338
60513
04634
09297
71197
27649
84898
111
112
62568
45149
61041
113
70206
40325
75730
94322
03699
71080
22553
11486
114
115
32992
77684
66280
24709
11776
70915
32592
03819
56202
14526
02938
31893
50490
41448
73698
65103
23417
84407
58806
04266
116
117
14459
26056
31424
62183
80371
70632
62253
26185
61181
75532
38167
73190
98532
32533
07118
55972
86382
84826
11937
118
04470
29669
90785
65956
95857
35476
71487
13873
119
120
87664
39421
92099
65850
98624
43742
66979
35435
47052
75186
121
122
09984
81598
29077
95052
14863
61683
73592
62224
51025
95761
90908
56027
87136
41842
123
54580
81507
27102
55892
33063
81868
124
71035
96746
09001
43367
37823
49497
71868
72719
18442
96758
35119
27611
62103
48409
85117
91596
39244
125
126
127
96927
43909
12149
19931
36089
25330
74192
77567
88741
16925
41903
99477
14227
64359
14374
40085
13352
36071
87209
128
15689
06565
49367
54303
06489
81982
36759
69051
05007
68732
129
130
58984
64817
68288
87174
22913
09517
18638
84534
00795
87201
08727
97245
131
132
16632
55259
81194
84292
14873
08796
04197
43165
85576
93739
45195
96565
97150
31685
18132
133
45740
41807
78416
55658
65561
18329
39100
33302
07051
93623
09547
134
27816
21337
78458
35213
11206
37741
19876
04312
68508
31260
135
136
137
66925
08421
53645
87151
79140
98481
44753
77377
28744
47836
75592
12609
08563
15373
92454
14592
66812
68908
61421
40772
138
139
140
66831
55588
21558
47781
33586
79177
06928
99404
70708
13048
41098
43563
72321
56934
81940
48394
00360
51719
02428
12975
96767
72829
13258
35964
50232
45144
141
23822
97892
96012
63408
94591
77919
65194
44575
50842
24870
53372
04178
142
193
194
603i3
52884
37569
85187
50706
5316i
69ô27
88389
44692
23361
56680
79003
67094
15019
63261
24543
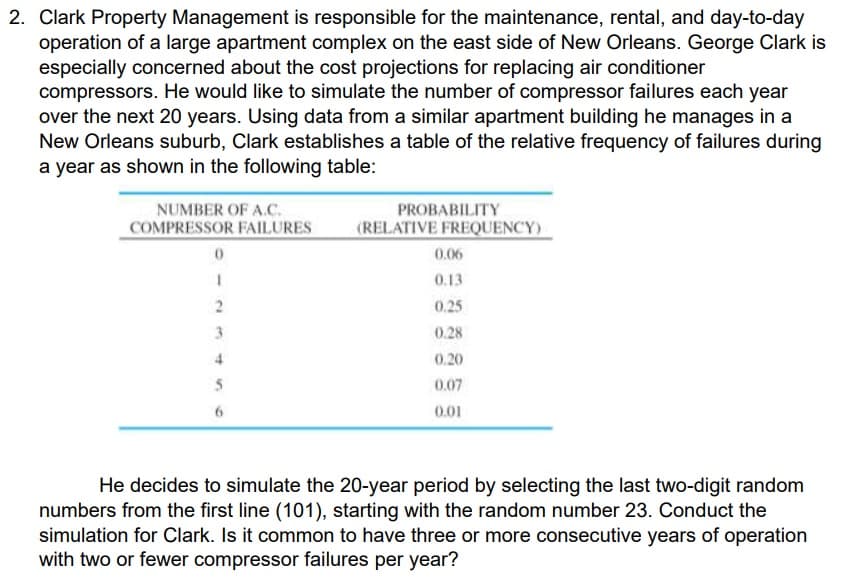
Transcribed Image Text:2. Clark Property Management is responsible for the maintenance, rental, and day-to-day
operation of a large apartment complex on the east side of New Orleans. George Clark is
especially concerned about the cost projections for replacing air conditioner
compressors. He would like to simulate the number of compressor failures each year
over the next 20 years. Using data from a similar apartment building he manages in a
New Orleans suburb, Clark establishes a table of the relative frequency of failures during
a year as shown in the following table:
NUMBER OF A.C.
PROBABILITY
COMPRESSOR FAILURES
(RELATIVE FREQUENCY)
0.06
0.13
0.25
0.28
4
0.20
5
0.07
0.01
He decides to simulate the 20-year period by selecting the last two-digit random
numbers from the first line (101), starting with the random number 23. Conduct the
simulation for Clark. Is it common to have three or more consecutive years of operation
with two or fewer compressor failures per year?
Expert Solution
This question has been solved!
Explore an expertly crafted, step-by-step solution for a thorough understanding of key concepts.

This is a popular solution!

Trending now
This is a popular solution!

Step by step
Solved in 2 steps with 2 images

Recommended textbooks for you
Functions and Change: A Modeling Approach to Coll…
Algebra
ISBN:
9781337111348
Author:
Bruce Crauder, Benny Evans, Alan Noell
Publisher:
Cengage Learning

Linear Algebra: A Modern Introduction
Algebra
ISBN:
9781285463247
Author:
David Poole
Publisher:
Cengage Learning

Glencoe Algebra 1, Student Edition, 9780079039897…
Algebra
ISBN:
9780079039897
Author:
Carter
Publisher:
McGraw Hill
Functions and Change: A Modeling Approach to Coll…
Algebra
ISBN:
9781337111348
Author:
Bruce Crauder, Benny Evans, Alan Noell
Publisher:
Cengage Learning
Linear Algebra: A Modern Introduction
Algebra
ISBN:
9781285463247
Author:
David Poole
Publisher:
Cengage Learning
Glencoe Algebra 1, Student Edition, 9780079039897…
Algebra
ISBN:
9780079039897
Author:
Carter
Publisher:
McGraw Hill