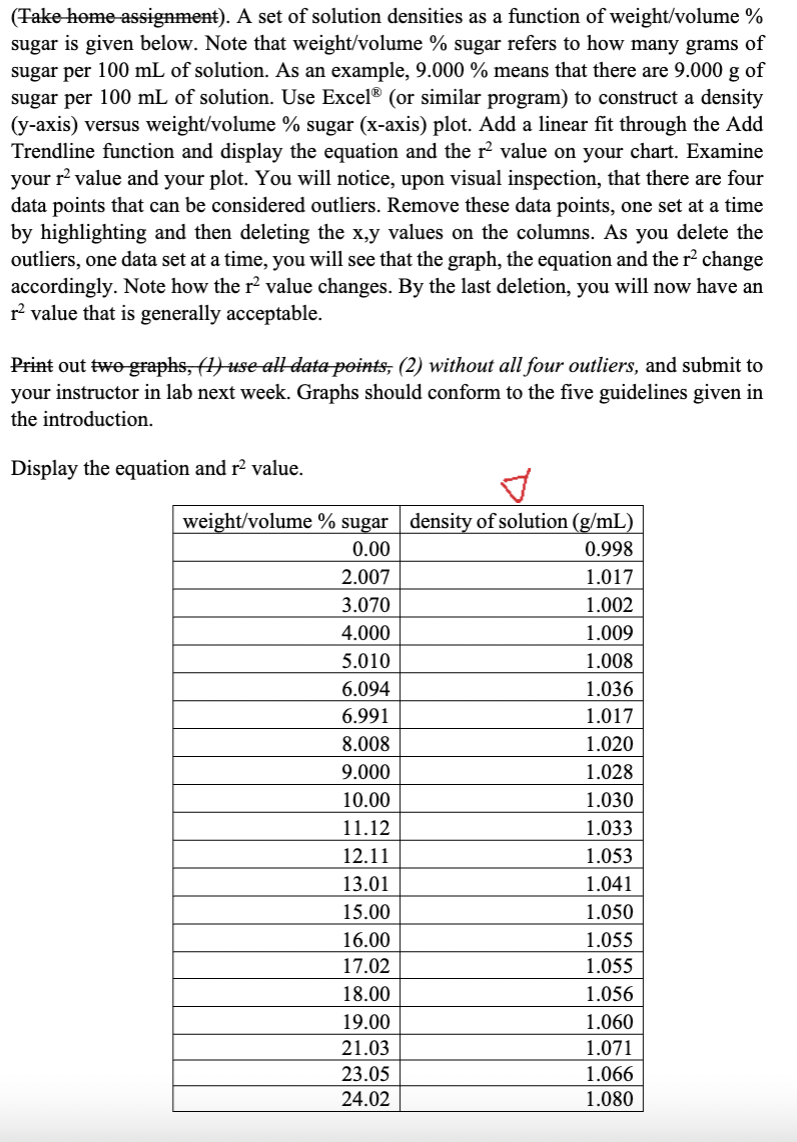
(Take home assignment). A set of solution densities as a function of weight/volume % sugar is given below. Note that weight/volume % sugar refers to how many grams of sugar per 100 mL of solution. As an example, 9.000 % means that there are 9.000 g of sugar per 100 mL of solution. Use Excel® (or similar program) to construct a density (y-axis) versus weight/volume % sugar (x-axis) plot. Add a linear fit through the Add Trendline function and display the equation and the r² value on your chart. Examine your r² value and your plot. You will notice, upon visual inspection, that there are four data points that can be considered outliers. Remove these data points, one set at a time by highlighting and then deleting the x,y values on the columns. As you delete the outliers, one data set at a time, you will see that the graph, the equation and the r² change accordingly. Note how the r² value changes. By the last deletion, you will now have an r² value that is generally acceptable. Print out two graphs, (1) use all data points, (2) without all four outliers, and submit to your instructor in lab next week. Graphs should conform to the five guidelines given in the introduction. Display the equation and r² value. weight/volume % sugar density of solution (g/mL) 0.00 0.998 2.007 1.017 1.002 1.009 1.008 1.036 1.017 1.020 1.028 1.030 1.033 1.053 1.041 1.050 1.055 1.055 1.056 3.070 4.000 5.010 6.094 6.991 8.008 9.000 10.00 11.12 12.11 13.01 15.00 16.00 17.02 18.00 19.00 21.03 23.05 24.02 1.060 1.071 1.066 1.080 weight/volu me% sugar 0 2.007 3.070 4.000 5.0100 6.094 6.991 8.008 9.000 10.00 11.12 12.11 13.01 15.00 16.00 17.02 18.00 19.00 21.03 23.05 24.02 density of solution (g/mL) 0.998 1.017 1.002 1.009 1.008 1.036 1.017 1.020 1.028 1.030 1.033 1.053 1.041 1.050 1.055 1.055 1.056 1.060 1.071 1.066 1.080 ranges 1.090 1.080 1.070 1.060 1.050 1.040 1.030 1.020 1.010 1.000 0.990 0 5 10 density graph 15 numbers list 20 25 30 y = 0.0032x + 0.9999 R² = 0.9207 Series 1 ......... Linear (Series1)
(Take home assignment). A set of solution densities as a function of weight/volume % sugar is given below. Note that weight/volume % sugar refers to how many grams of sugar per 100 mL of solution. As an example, 9.000 % means that there are 9.000 g of sugar per 100 mL of solution. Use Excel® (or similar program) to construct a density (y-axis) versus weight/volume % sugar (x-axis) plot. Add a linear fit through the Add Trendline function and display the equation and the r² value on your chart. Examine your r² value and your plot. You will notice, upon visual inspection, that there are four data points that can be considered outliers. Remove these data points, one set at a time by highlighting and then deleting the x,y values on the columns. As you delete the outliers, one data set at a time, you will see that the graph, the equation and the r² change accordingly. Note how the r² value changes. By the last deletion, you will now have an r² value that is generally acceptable. Print out two graphs, (1) use all data points, (2) without all four outliers, and submit to your instructor in lab next week. Graphs should conform to the five guidelines given in the introduction. Display the equation and r² value. weight/volume % sugar density of solution (g/mL) 0.00 0.998 2.007 1.017 1.002 1.009 1.008 1.036 1.017 1.020 1.028 1.030 1.033 1.053 1.041 1.050 1.055 1.055 1.056 3.070 4.000 5.010 6.094 6.991 8.008 9.000 10.00 11.12 12.11 13.01 15.00 16.00 17.02 18.00 19.00 21.03 23.05 24.02 1.060 1.071 1.066 1.080 weight/volu me% sugar 0 2.007 3.070 4.000 5.0100 6.094 6.991 8.008 9.000 10.00 11.12 12.11 13.01 15.00 16.00 17.02 18.00 19.00 21.03 23.05 24.02 density of solution (g/mL) 0.998 1.017 1.002 1.009 1.008 1.036 1.017 1.020 1.028 1.030 1.033 1.053 1.041 1.050 1.055 1.055 1.056 1.060 1.071 1.066 1.080 ranges 1.090 1.080 1.070 1.060 1.050 1.040 1.030 1.020 1.010 1.000 0.990 0 5 10 density graph 15 numbers list 20 25 30 y = 0.0032x + 0.9999 R² = 0.9207 Series 1 ......... Linear (Series1)

Chapter11: Properties Of Solutions
Section: Chapter Questions
Problem 109AE: Patients undergoing an upper gastrointestinal tract laboratory test are typically given an X-ray...

Related questions
Question
I need help on figuring out which are the four data points that can be considered outliers, below is my graph following the intructions but, not I dont know which points are outliners.
Transcribed Image Text:(Take home assignment). A set of solution densities as a function of weight/volume %
sugar is given below. Note that weight/volume % sugar refers to how many grams of
sugar per 100 mL of solution. As an example, 9.000 % means that there are 9.000 g of
sugar per 100 mL of solution. Use Excel® (or similar program) to construct a density
(y-axis) versus weight/volume % sugar (x-axis) plot. Add a linear fit through the Add
Trendline function and display the equation and the r² value on your chart. Examine
your r² value and your plot. You will notice, upon visual inspection, that there are four
data points that can be considered outliers. Remove these data points, one set at a time
by highlighting and then deleting the x,y values on the columns. As you delete the
outliers, one data set at a time, you will see that the graph, the equation and the r² change
accordingly. Note how the r² value changes. By the last deletion, you will now have an
r² value that is generally acceptable.
Print out two graphs, (1) use all data points, (2) without all four outliers, and submit to
your instructor in lab next week. Graphs should conform to the five guidelines given in
the introduction.
Display the equation and r² value.
weight/volume % sugar density of solution (g/mL)
0.00
0.998
2.007
1.017
1.002
1.009
1.008
1.036
1.017
1.020
1.028
1.030
1.033
1.053
1.041
1.050
1.055
1.055
1.056
3.070
4.000
5.010
6.094
6.991
8.008
9.000
10.00
11.12
12.11
13.01
15.00
16.00
17.02
18.00
19.00
21.03
23.05
24.02
1.060
1.071
1.066
1.080
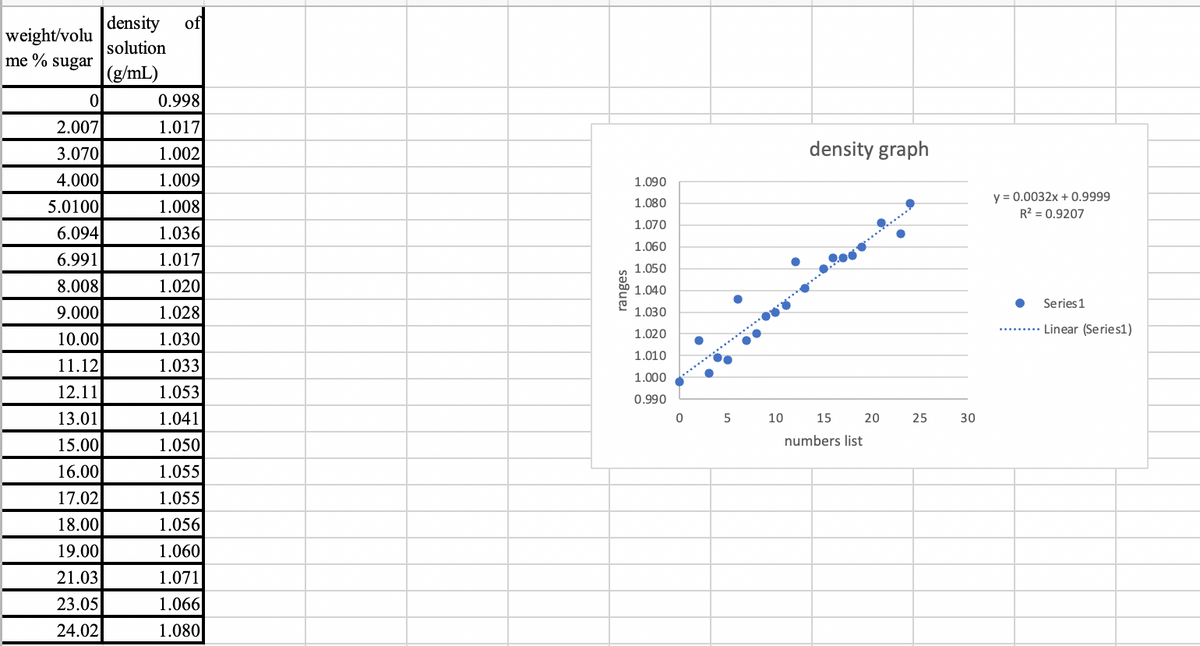
Transcribed Image Text:weight/volu
me% sugar
0
2.007
3.070
4.000
5.0100
6.094
6.991
8.008
9.000
10.00
11.12
12.11
13.01
15.00
16.00
17.02
18.00
19.00
21.03
23.05
24.02
density of
solution
(g/mL)
0.998
1.017
1.002
1.009
1.008
1.036
1.017
1.020
1.028
1.030
1.033
1.053
1.041
1.050
1.055
1.055
1.056
1.060
1.071
1.066
1.080
ranges
1.090
1.080
1.070
1.060
1.050
1.040
1.030
1.020
1.010
1.000
0.990
0 5
10
density graph
15
numbers list
20
25
30
y = 0.0032x + 0.9999
R² = 0.9207
Series 1
......... Linear (Series1)
AI-Generated Solution

Unlock instant AI solutions
Tap the button
to generate a solution
Recommended textbooks for you

Chemistry
Chemistry
ISBN:
9781305957404
Author:
Steven S. Zumdahl, Susan A. Zumdahl, Donald J. DeCoste
Publisher:
Cengage Learning

Chemistry: An Atoms First Approach
Chemistry
ISBN:
9781305079243
Author:
Steven S. Zumdahl, Susan A. Zumdahl
Publisher:
Cengage Learning
Chemistry
Chemistry
ISBN:
9781305957404
Author:
Steven S. Zumdahl, Susan A. Zumdahl, Donald J. DeCoste
Publisher:
Cengage Learning
Chemistry: An Atoms First Approach
Chemistry
ISBN:
9781305079243
Author:
Steven S. Zumdahl, Susan A. Zumdahl
Publisher:
Cengage Learning


Introduction to General, Organic and Biochemistry
Chemistry
ISBN:
9781285869759
Author:
Frederick A. Bettelheim, William H. Brown, Mary K. Campbell, Shawn O. Farrell, Omar Torres
Publisher:
Cengage Learning