Task 1 - Part D, Q1 Part D Next, you'll use your spreadsheet to create a graph. The graph will help you visualize how the actual temperature changed from 1880 to 2016. Question 1 Which type of graph (bar graph, pie chart, scatter plot, for example) do you think would be best for this task? Explain your reasoning. 15px B V IUX² X₂ AEEEEEEE I believe we discussed the reasoning for choosing graphs a couple of weeks ago. But here is a recap: A. A bar graph is used when you have a closed set of data (nothing can be added to it). It displays independent and dependent variables. B. A pie chart (or circle graph) is used to show how 100% of the data can be divided into parts based a difference within the data set. C. A scatter plot is used when you have an open set of data (that means more information can be added in the future to track changes). Which type of graph would be used here and why? You have to answer both questions (which type and why) to get full credit. D E www √く SAMSUNG S =S Dec 8 8:22
Task 1 - Part D, Q1 Part D Next, you'll use your spreadsheet to create a graph. The graph will help you visualize how the actual temperature changed from 1880 to 2016. Question 1 Which type of graph (bar graph, pie chart, scatter plot, for example) do you think would be best for this task? Explain your reasoning. 15px B V IUX² X₂ AEEEEEEE I believe we discussed the reasoning for choosing graphs a couple of weeks ago. But here is a recap: A. A bar graph is used when you have a closed set of data (nothing can be added to it). It displays independent and dependent variables. B. A pie chart (or circle graph) is used to show how 100% of the data can be divided into parts based a difference within the data set. C. A scatter plot is used when you have an open set of data (that means more information can be added in the future to track changes). Which type of graph would be used here and why? You have to answer both questions (which type and why) to get full credit. D E www √く SAMSUNG S =S Dec 8 8:22

Applications and Investigations in Earth Science (9th Edition)
9th Edition
ISBN:9780134746241
Author:Edward J. Tarbuck, Frederick K. Lutgens, Dennis G. Tasa
Publisher:Edward J. Tarbuck, Frederick K. Lutgens, Dennis G. Tasa
Chapter1: The Study Of Minerals
Section: Chapter Questions
Problem 1LR

Related questions
Question
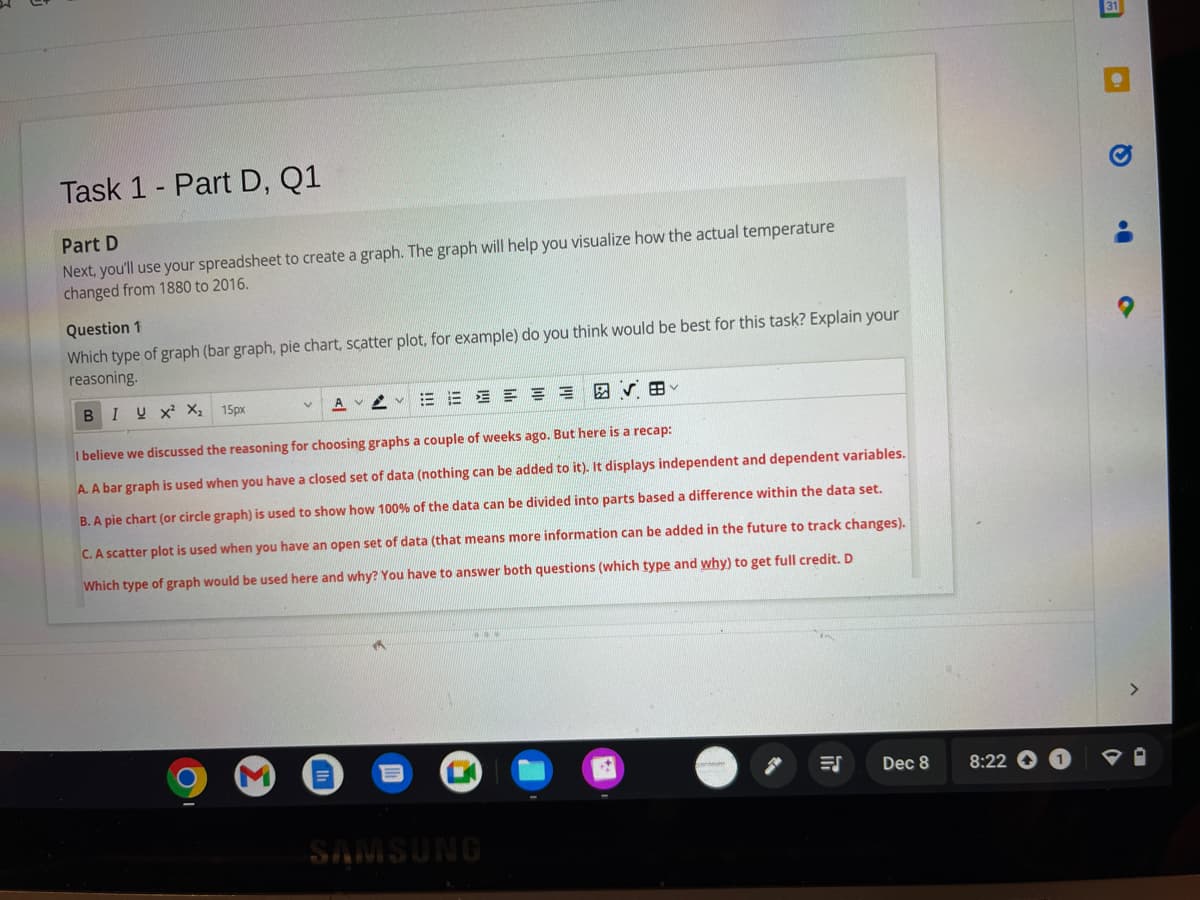
Transcribed Image Text:Task 1 - Part D, Q1
Part D
Next, you'll use your spreadsheet to create a graph. The graph will help you visualize how the actual temperature
changed from 1880 to 2016.
Question 1
Which type of graph (bar graph, pie chart, scatter plot, for example) do you think would be best for this task? Explain your
reasoning.
BI U X² X₂
15px
Av E E = = = =
8V
I believe we discussed the reasoning for choosing graphs a couple of weeks ago. But here is a recap:
A. A bar graph is used when you have a closed set of data (nothing can be added to it). It displays independent and dependent variables.
B. A pie chart (or circle graph) is used to show how 100% of the data can be divided into parts based a difference within the data set.
C. A scatter plot is used when you have an open set of data (that means more information can be added in the future to track changes).
Which type of graph would be used here and why? You have to answer both questions (which type and why) to get full credit. D
M
SAMSUNG
*
Dec 8
8:22
a
Expert Solution
This question has been solved!
Explore an expertly crafted, step-by-step solution for a thorough understanding of key concepts.

This is a popular solution!

Trending now
This is a popular solution!

Step by step
Solved in 3 steps

Recommended textbooks for you
Applications and Investigations in Earth Science …
Earth Science
ISBN:
9780134746241
Author:
Edward J. Tarbuck, Frederick K. Lutgens, Dennis G. Tasa
Publisher:
PEARSON

Exercises for Weather & Climate (9th Edition)
Earth Science
ISBN:
9780134041360
Author:
Greg Carbone
Publisher:
PEARSON

Environmental Science
Earth Science
ISBN:
9781260153125
Author:
William P Cunningham Prof., Mary Ann Cunningham Professor
Publisher:
McGraw-Hill Education
Applications and Investigations in Earth Science …
Earth Science
ISBN:
9780134746241
Author:
Edward J. Tarbuck, Frederick K. Lutgens, Dennis G. Tasa
Publisher:
PEARSON
Exercises for Weather & Climate (9th Edition)
Earth Science
ISBN:
9780134041360
Author:
Greg Carbone
Publisher:
PEARSON
Environmental Science
Earth Science
ISBN:
9781260153125
Author:
William P Cunningham Prof., Mary Ann Cunningham Professor
Publisher:
McGraw-Hill Education

Earth Science (15th Edition)
Earth Science
ISBN:
9780134543536
Author:
Edward J. Tarbuck, Frederick K. Lutgens, Dennis G. Tasa
Publisher:
PEARSON

Environmental Science (MindTap Course List)
Earth Science
ISBN:
9781337569613
Author:
G. Tyler Miller, Scott Spoolman
Publisher:
Cengage Learning

Physical Geology
Earth Science
ISBN:
9781259916823
Author:
Plummer, Charles C., CARLSON, Diane H., Hammersley, Lisa
Publisher:
Mcgraw-hill Education,