Task 9: The following table shows a typical output for an analysis with two influencing factors. Here, the statistical software SAS was used to assess the lung function of 111 asthma patients as a function of treatment and initial health status (2 categories: "good" or "poor"). Solution for Fixed Effects Treatment InitHealth Estimate Standard Error DF t Value Pr>|t| 1.7880 0.1606 108 11.13 <.0001 0.7477 0.1925 108 3.88 0.0002 Effect Intercept Treatment Active Treatment Placebo InitHealth InitHealth Effect Treatment InitHealth Good Poor Type 3 Tests of Fixed Effects 0 1.0071 0 Num DF Den DF F Value Pr>F 1 108 15.09 0.0002 1 108 27.12 <.0001 0.1934 108 5.21 <.0001 a) Can you translate the output into a statistical model? Try to write down the model formula. The target value is FEV1s. High values mean a good result. b) Interpret the results of the analysis regarding the effectiveness of the treatment and the influence of the health status. c) What conclusions can be drawn regarding the possible difference in treatment efficacy between good and poor health? What method could be used to investigate this question in more detail?
Task 9: The following table shows a typical output for an analysis with two influencing factors. Here, the statistical software SAS was used to assess the lung function of 111 asthma patients as a function of treatment and initial health status (2 categories: "good" or "poor"). Solution for Fixed Effects Treatment InitHealth Estimate Standard Error DF t Value Pr>|t| 1.7880 0.1606 108 11.13 <.0001 0.7477 0.1925 108 3.88 0.0002 Effect Intercept Treatment Active Treatment Placebo InitHealth InitHealth Effect Treatment InitHealth Good Poor Type 3 Tests of Fixed Effects 0 1.0071 0 Num DF Den DF F Value Pr>F 1 108 15.09 0.0002 1 108 27.12 <.0001 0.1934 108 5.21 <.0001 a) Can you translate the output into a statistical model? Try to write down the model formula. The target value is FEV1s. High values mean a good result. b) Interpret the results of the analysis regarding the effectiveness of the treatment and the influence of the health status. c) What conclusions can be drawn regarding the possible difference in treatment efficacy between good and poor health? What method could be used to investigate this question in more detail?

Glencoe Algebra 1, Student Edition, 9780079039897, 0079039898, 2018
18th Edition
ISBN:9780079039897
Author:Carter
Publisher:Carter
Chapter4: Equations Of Linear Functions
Section4.5: Correlation And Causation
Problem 2CYU

Related questions
Question
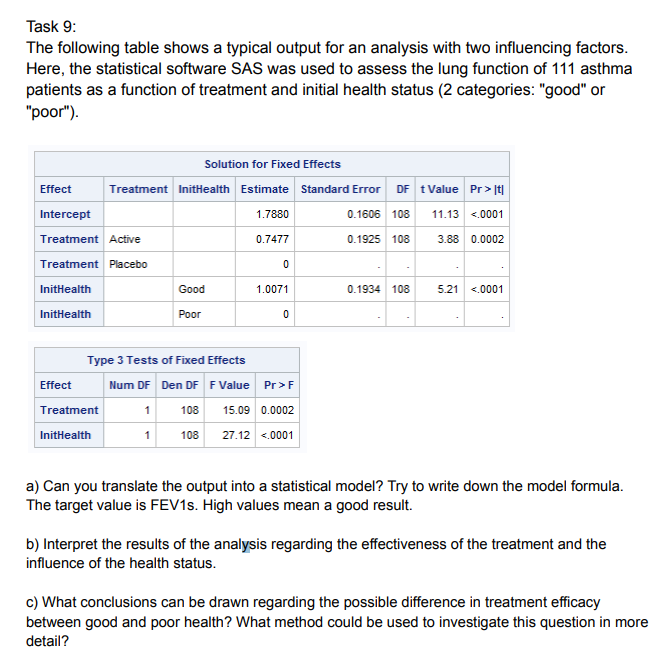
Transcribed Image Text:Task 9:
The following table shows a typical output for an analysis with two influencing factors.
Here, the statistical software SAS was used to assess the lung function of 111 asthma
patients as a function of treatment and initial health status (2 categories: "good" or
"poor").
Effect
Intercept
Treatment Active
Solution for Fixed Effects
Treatment InitHealth Estimate Standard Error DF t Value Pr>|t|
1.7880
0.1606 108 11.13 <.0001
0.7477
3.88 0.0002
Treatment Placebo
InitHealth
InitHealth
Effect
Treatment
InitHealth
Good
Poor
0
1.0071
0
Type 3 Tests of Fixed Effects
Num DF
Den DF F Value
Pr>F
1 108 15.09 0.0002
1
108 27.12 <.0001
0.1925 108
0.1934 108
5.21 <.0001
a) Can you translate the output into a statistical model? Try to write down the model formula.
The target value is FEV1s. High values mean a good result.
b) Interpret the results of the analysis regarding the effectiveness of the treatment and the
influence of the health status.
c) What conclusions can be drawn regarding the possible difference in treatment efficacy
between good and poor health? What method could be used to investigate this question in more
detail?
Expert Solution
This question has been solved!
Explore an expertly crafted, step-by-step solution for a thorough understanding of key concepts.

Step by step
Solved in 4 steps

Recommended textbooks for you
Glencoe Algebra 1, Student Edition, 9780079039897…
Algebra
ISBN:
9780079039897
Author:
Carter
Publisher:
McGraw Hill

Functions and Change: A Modeling Approach to Coll…
Algebra
ISBN:
9781337111348
Author:
Bruce Crauder, Benny Evans, Alan Noell
Publisher:
Cengage Learning
Glencoe Algebra 1, Student Edition, 9780079039897…
Algebra
ISBN:
9780079039897
Author:
Carter
Publisher:
McGraw Hill
Functions and Change: A Modeling Approach to Coll…
Algebra
ISBN:
9781337111348
Author:
Bruce Crauder, Benny Evans, Alan Noell
Publisher:
Cengage Learning